Projection of the EOS onto the limb leads
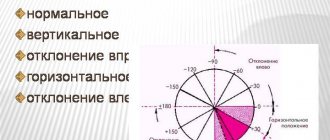
The position of the EOS is determined by a six-axis diagram, in which the axes are standard and enhanced limb leads (Diagram 2).
Scheme 2. Six-axis diagram for determining EOS in the frontal plane
The position of the EOS is determined in degrees in accordance with this diagram.
The diagram shows six limb leads: I, II, III, aVL, aVF, aVR. Standard lead I was taken as the reference point. Next to each lead it is indicated what deviation in degrees the EOS will correspond to if the electrical excitation wave is directed to this lead.
If the EOS is oriented towards lead I, then the angle of deviation of the EOS is zero. In such cases, we talk about the horizontal position of the EOS. If the EOS is oriented towards lead aVF, then the angle of deflection of the EOS is 900. In such cases, we speak of the vertical position of the EOS.
For diagnostic purposes, the following assessments of the position of the electrical axis of the heart are used:
- Normal EOS position: from -30o to 90o.
- EOS deviation to the left: from -30o to -90o.
- EOS deviation to the right: from 90o to 180o.
- Sharp (or extreme) deviation of EOS: from -90o to 180o.
In addition, within the normal position of the EOS, the terms horizontal position of the EOS (from 00 to 300) and vertical position of the EOS (from 700 to 900) are used.
With various pathological changes, the position of the EOS can change significantly and this explains the diagnostic value of this ECG parameter. There are several reasons for deviation of EOS in pathology:
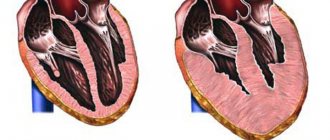
- With left ventricular hypertrophy, overload of the left ventricle (for example, with arterial hypertension), and slower conduction of excitation through the left ventricle, electrical activity in the left half of the heart increases. This often leads to deviation of the EOS to the left.
- With right ventricular hypertrophy, overload of the right ventricle (for example, with pulmonary embolism), or slower conduction of excitation through the right ventricle, electrical activity in the right half of the heart increases. This often leads to deviation of the EOS to the right.
The significance of EOS deviations for various violations will be discussed in more detail in the relevant sections.
Diagnostics
Bringing together the symptoms of the disorder, functional diagnostics, and other methods help to establish the disorder:
- ECG for determining EOS, interpretation of indicators, norms and deviations
- Ultrasound;
- Holter monitoring;
- ECG;
- X-ray;
- coronary angiography.
Thanks to these studies, it is possible to visually assess the organ and its parts, determine the size of the enlarged cavity, and establish the cause of the insufficiency.
Using electrocardiography with a load in the form of a bicycle track or an exercise bike, it is possible to determine at what point myocardial ischemia appears.
The doctor prescribes a daily test if he suspects that the patient has an arrhythmia disorder; the person is fitted with a device for a day that records the contraction of the heart.
Angiocoronary angiography is a study of blood vessels, allowing one to see their condition and circulatory disorders. The image allows you to determine the expansion of the shadow of the organ, which indicates hypertrophy.
Assessing the position of the EOS using ECG
The position of the EOS on the cardiogram is determined by the QRS complexes, which are recorded in the limb leads: I, II, III, aVL, aVF, aVR. In order to evaluate the EOS, it is necessary to find among the listed leads those in which the algebraic sum of the teeth of the QRS complex, i.e. R - (Q+S), maximum, minimum and equal to zero (or close to zero).
The EOS is directed from the lead in which the sum of the QRS waves is the smallest (negative), towards the lead in which the sum of the QRS waves is the largest (positive), and perpendicular to the lead in which the sum of the QRS waves is zero.
See how this looks in ECG 1.
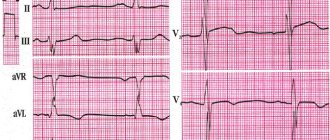
ECG 1. EOS deviation to the left. The angle is -300
On ECG 1 it is easy to determine that the maximum algebraic sum of QRS waves is recorded in lead aVL. In aVL, the tooth R = 17 mm, Q = 2 mm, the tooth S is absent, so the sum of the teeth is 15 mm (since 17 mm - 2 mm = 15 mm).
Similarly, we determine that the minimum algebraic sum of QRS waves will be in lead III: R = 3 mm, S = 19 mm, there is no Q wave, so the sum of the teeth is -16 mm (since 3 mm - 19 mm = -16 mm) .
The algebraic sum of the waves R - (Q + S) is equal to or close to zero in lead II.
Therefore, in this example, the electrical axis of the heart is directed from lead III towards lead aVL and perpendicular to lead II. This means that the deviation angle is -300, and in such cases they speak of EOS deviation to the left.
The table in Scheme 3 lists possible combinations of R-(Q+S) values for different EOS positions.
Scheme 3. Table for determining the position of the EOS
Let's consider these options for the location of the EOS using specific examples.
Symptoms
EOS displacement itself does not have characteristic symptoms.
The diseases that accompany it can also be asymptomatic. That is why it is important to undergo an ECG for preventive purposes - if the disease is not accompanied by unpleasant symptoms, you can find out about it and begin treatment only after deciphering the cardiogram.
However, sometimes these diseases still make themselves felt.
Symptoms of diseases that are accompanied by a displacement of the electrical axis:
| LVH | Left bundle branch block |
| Attacks of chest pain, shortness of breath, arrhythmias, increases and changes in blood pressure, headaches and visual disturbances associated with increased blood pressure | Bradycardia (slow heartbeat), dizziness, and sometimes fainting |
But let us repeat once again - symptoms do not always appear; they usually develop in the later stages of the disease.
Normal position of the EOS
There are three options for the normal position of the EOS:
- horizontal position of the EOS with an angle from 00 to 300.
- normal position of the EOS with an angle equal to or about 600.
- vertical position of EOS from 700 to 900.
With a horizontal deviation of the EOS with an angle of 00, the maximum positive sum is R-(Q+S) in lead I, the maximum negative sum is R-(Q+S) in lead aVR. The algebraic sum of the waves R - (Q + S) is equal to or close to zero in lead aVF.
ECG 3. Normal (horizontal) position of the EOS. Angle is 0
ECG source.
With a normal EOS deviation with an angle of +300, the maximum positive sum is R-(Q+S) in leads I and II, the maximum negative sum is R-(Q+S) in lead aVR. The algebraic sum of the waves R - (Q + S) is equal to or close to zero in lead III.
ECG 4. Normal position of the EOS. The angle is +300
ECG source.
With a normal EOS deviation with an angle of +600, the maximum positive sum is R-(Q+S) in lead II, the maximum negative sum is R-(Q+S) in lead aVR. The algebraic sum of the waves R - (Q + S) is equal to or close to zero in lead aVL.
ECG 5. Normal position of the EOS. The angle is +600
ECG source.
With a vertical deviation of the EOS with an angle of +900, the maximum positive sum is R-(Q+S) in lead aVF, the maximum negative sum is R-(Q+S) in leads aVR and aVR. The algebraic sum of the waves R - (Q + S) is equal to or close to zero in lead I.
ECG 6. Normal (vertical) position of the EOS. The angle is +900
ECG source.
What is the resulting vector?
An electrocardiogram is a test that measures the electrical activity of the heartbeat. With each beat, an electrical impulse (or "wave") travels through the heart. This wave causes the muscle to contract and pump blood away from the heart. A normal heartbeat on an ECG will show the synchronization of the upper and lower chambers.
ECG waves are caused by depolarization, not contraction, of the heart. This wave of depolarization occurs before the heart muscle begins to contract. A normal ECG consists of 5 waves, labeled from left to right as P, Q, R, S, and T. The P, R, and T waves are usually upward or positive waves, while the Q and S are usually downward or negative waves.
The right and left atria or superior chambers form the first wave, called the “P wave.” The right and left lower chambers or ventricles produce the next wave called the “QRS complex.” The final wave or “T wave” represents the electrical recovery or return of the ventricles to a resting state.
The resulting vector is the sum of 3 moments of excitation: the base of the heart, its apex and the interventricular septum (Q + R + S).
The alpha angle on the ECG is the sum of the positive and negative wave numbers of the interventricular complex (Q + R + S).
The amount of voltage recorded on the ECG is directly proportional to the amount of depolarized tissue. The majority of the heart's mass is made up of the ventricular myocardium. Therefore, the largest recorded waveform, the QRS complex, the resulting vector, reflects ventricular depolarization.
In addition, because the mass of the left ventricle is significantly greater than that of the right ventricle, most of the QRS complex reflects left ventricular depolarization, and the orientation of the mean electrical axis is to the left of the interventricular septum.
A good mathematical tool to represent the lead measurement is a vector. A vector is an object that has both magnitude and direction, such as speed.
At any point in the cardiac cycle, a vector can represent the net electrical activity observed by a lead (a standard ECG is represented by 12 leads). An electrical vector has a magnitude, direction, and polarity and is usually represented graphically as an arrow.
EOS deviation to the right
When the EOS deviates to the right with an angle of +1200, the maximum positive sum is R-(Q+S) in lead III, the maximum negative sum is R-(Q+S) in lead aVL. The algebraic sum of the R waves - (Q + S) is equal to or close to zero in lead aVR.
ECG 7. EOS deviation to the right. The angle is +1200
ECG source.
When the EOS deviates to the right with an angle of +1500, the maximum positive sum is R-(Q+S) in lead III, the maximum negative sum is R-(Q+S) in lead aVL. The algebraic sum of the waves R - (Q + S) is equal to or close to zero in lead II.
ECG 8. EOS deviation to the right. The angle is +1500
ECG source.
Diseases that are accompanied by levogram
If a patient has a deviation in EOS, this may be a consequence of diseases such as:
- coronary heart disease (CHD);
- cardiopathy of various origins;
- chronic heart failure (CHF) of the left ventricular type;
- congenital heart defects;
- myocardial infarction;
- infectious damage to the myocardium.
In addition to diseases, blockage of the conduction system of the heart can result from taking certain medications.
Comparison of Q and S waves of the QRS complex
The complete QRS complex consists of the Q, R and S waves. However, all 3 waves may not be visible, and there are always differences between leads. Some leads can reflect all waves, while others can only reflect 1 wave. If the first wave is negative, then it is called a Q wave. If it is not negative, this means that the complex does not have this wave, regardless of the appearance of the QRS complex.
Any negative wave that occurs after a positive one is called an S wave.
The Q wave reflects the excitation of the left half of the interventricular septum.
The S wave is the deepest negative wave and indicates the terminal excitation of the base of the left ventricle.
The QS complex is not usually considered a sign of previous myocardial infarction. But there may be other causes, especially in older people, such as left ventricular hypertrophy.