Hypertrophy is a pathological process, which is based on an increase in the volume and number of cells. As a result, the mass of tissues increases, which leads to disruption of their functional activity. If such changes occur in the heart muscle, hypertrophic changes occur in the myocardium. Hypertrophy of various parts of the heart is not a disease, but only a sign of some kind of disorder.
In general, the topic of thickening the walls of the heart muscle is quite controversial. Some doctors call these changes an adaptive mechanism, while others argue that this is a dangerous condition with far-reaching consequences. It is known that such pathological changes in the ventricles are associated with the occurrence of diseases, but along with this, there are examples of people with this diagnosis who can even play sports, live to old age and not complain of any heart problems. So how should you feel about changes on the cardiogram?
The main job of the ventricles is to carry out the pumping function. In general, the term “hypertrophy” itself is a capacious concept that includes excess tissue, organ enlargement, thickening of the walls of the ventricles and an increase in the mass of the atria. Hyperfunction leads to hypertrophic changes.
The presence of disorders may be indicated by patient complaints: cardialgia of a pressing nature, swelling of the lower extremities, shortness of breath when walking, weakness and dizziness. The following categories of people are at risk: those who exhaust themselves with radical diets, engage in grueling physical training, and have bad habits, in particular, smoking and alcohol abuse. In addition, people who have close relatives with heart disease are at risk.
Athletes who increase their physical activity must be examined by a doctor. Decompensated changes may appear after a long time
Left ventricular hypertrophy on ECG
LVH can occur for a number of reasons, one of the provoking factors is high blood pressure, the left ventricle works at an accelerated rhythm. First, the walls of the chamber thicken, which subsequently leads to loss of elasticity and deterioration in functional activity. In children, heart failure is usually associated with congenital heart defects.
Let us highlight the main reasons why left ventricular hypertrophy appears on the ECG:
- narrowing of the aortic valve;
- arterial hypertension;
- pathological enlargement of the heart muscle;
- grueling long-term strength physical activity;
- excess body weight.
Consider the clinical signs of left ventricular hypertrophy on the ECG:
- pain in the chest area;
- dyspnea;
- tachycardia;
- dizziness, even fainting;
- increased fatigue.
The left ventricle is the most important link in the circulatory system. It is responsible for supplying blood to tissues and organs, which is why hypertrophic changes will certainly affect the functioning of the most important systems of the body.
To avoid the development of serious complications, the pathological process should be identified in the early stages. To do this, when the first symptoms appear, you need to contact a cardiologist.
LVH can lead to the following complications, namely:
- heart failure;
- IHD;
- arrhythmia;
- myocardial infarction;
- cardiac arrest and death.
If we talk about left atrial hypertrophy, it occurs due to the following reasons: obesity, cardiomyopathy of various origins, pulmonary diseases, aortic stenosis, hypertension, stressful situations, etc.
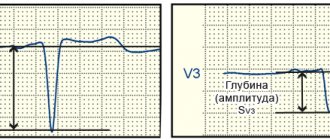
Changes in depolarization processes
Pathophysiological mechanism
There is an increase in the size of the cardiomyocyte. Therefore, the action potential increases and the electromotive force increases. As a result, the length of the vector of the hypertrophied section increases and the total vector of the heart deviates towards the hypertrophied section.
ECG manifestations of hypertrophy
- increase in amplitude and/or duration of ECG elements
- deviation of the electrical axis of the heart towards the hypertrophied section
- increase in internal deviation time
Right ventricular hypertrophy on ECG
Compared to the above-mentioned pathology, HPG is a rather rare phenomenon. There are four main causes of the violation:
- increased pressure in the pulmonary artery;
- congenital heart defects;
- pulmonary valve stenosis;
- defects on the side of the interventricular septum.
Let's look at the signs of right ventricular hypertrophy on the ECG:
- breathing problems;
- chest pain and squeezing sensation;
- feeling of heartbeat;
- feeling of heart fluttering and feeling as if it missed several beats;
- swelling;
- severe dizziness;
- loss of consciousness.
In the initial stages, prostate cancer may have absolutely no clinical manifestations.
Changes in the right atrium may also occur. The reason for this may be the following factors: lung diseases, heart defects, pulmonary embolism, etc. Patients experience breathing problems, fatigue, loss of strength, and chest pain.
Specifics and classification of the violation
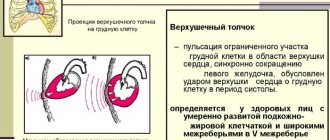
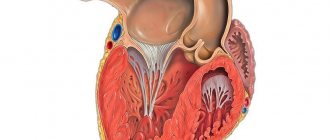
The shape and size of the heart are individual and depend on body type, lifestyle, gender, and age. This is a muscular organ that has four chambers - 2 ventricles and 2 atria. The wall has a three-layer structure - the endothelial layer, the myocardium, and the connective tissue layer.
The myocardium is a layer of highly specialized striated muscle tissue, densely saturated with capillaries and nerve fibers. Heart cells are not capable of simple division; they increase in volume due to the accumulation of various substances in the cytoplasm.
Structure of the heart wall
Cardiomyocytes contain a large number of contractile proteins - troponins, myosin, tropomyosin and others. If their synthesis is disrupted, the structure and arrangement of fibers is disrupted, and functions are reduced.
There are several classifications of cardiac hypertrophy. By form:
- Asymmetrical - uneven thickening of the wall of one or more cavities, for example, the apex, interventricular septum, hypertrophy of the anterior or posterior wall of one of the ventricles, atrial hypertrophy.
- Symmetrical - equal thickening of the muscle layer in all sections.
By time of occurrence:
- Acquired.
- Congenital.
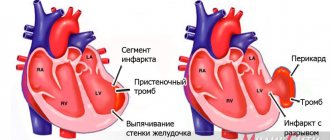
Thickening of the wall of the left ventricle
Concentric and eccentric hypertrophy are also distinguished. In the first case, the ratio of the thickness of the walls of the heart cavities and their volume is disrupted. In the second form, a more pronounced expansion of the cardiac chambers occurs with a slight increase in the muscle layer.
Depending on the blood flow disturbances, obstructive and non-obstructive forms are distinguished. There is also a classification based on myocardial thickness. Normally, this indicator during echocardioscopy is no more than 15 mm. With a moderate degree, the wall thickens up to 20 mm, average 20-25 mm, severe hypertrophy - more than 25 mm.
Based on the characteristics of the clinical course, several stages of development of myocardial hypertrophy are distinguished:
Compensated. The person has no active complaints, no blood flow disturbances are observed.- Subcompensated. Complaints appear when walking quickly, performance decreases, pressure in the cavity of the left ventricle rises to 36 mm Hg.
- Decompensated. There is a feeling of shortness of breath, lack of air, nagging pain behind the sternum when performing the usual work. LV pressure is 37-44.
- Expressed. Life-threatening condition, pronounced symptoms even when walking. The pressure in the heart cavity rises above 75.
Causes and symptoms of damage to different parts of the heart
Myocardial hypertrophy is caused by many reasons and is manifested by a variety of symptoms, often has a genetic predisposition or occurs secondary.
Left ventricle
This is the largest chamber of the heart; blood is ejected from it into the aorta to ensure the functioning of all internal organs. With hypertension, stenosis of the four-leaf valve, obesity, and physical activity, energy costs for muscle contraction increase, since greater pressure must be overcome.
If the tricuspid valve, located between the left atrium and the ventricle, is insufficient, during the period of relaxation of the heart, the ventricle is overloaded with a large amount of blood.
Departments of the heart
The organ begins to compensate for its function by increasing the muscle layer. Also, increased work of this muscle is necessary during stress, emotional instability, and insufficient rest because the number of heart contractions increases, and accordingly, more energy is expended.
The main symptom is the appearance of pain behind the sternum during physical and emotional stress, of a pressing or squeezing nature. This symptom is based on insufficient oxygen supply to cardiomyocytes, caused by narrowing of the capillaries during contraction of the thickened muscle.
Quite often, arrhythmia is a manifestation of left ventricular hypertrophy. A person feels a sinking heart, which is then replaced by a frequent and increased heartbeat.
This condition is accompanied by dizziness and darkening of the eyes due to insufficient blood flow to the brain. Other symptoms include shortness of breath, increased blood pressure, and disturbances in the general condition of the body.
Left atrium
Left atrial hypertrophy can occur either as a result of progression of left ventricular failure or as an independent pathology. The most common causes are hypertension and obesity.
With mitral valve stenosis, large amounts of energy are required to fill the left ventricle. With tricuspid valve insufficiency, part of the blood is thrown back into the atrium during contraction. The residual volume of blood is retained in the atrium, and the load increases accordingly.
Enlargement of the walls of the left atrium on the ECG
For quite a long time, the pathological process may not be accompanied by clinical symptoms; the heart uses compensation mechanisms. One of the main complaints with LA hypertrophy is shortness of breath.
In the initial stages, it occurs during intense physical activity and quickly goes away with rest. Then it can be complicated by cough, hemoptysis, and attacks of suffocation. Angina pectoris and arrhythmias almost always occur. All these manifestations significantly reduce the quality of life.
Right ventricle
Right ventricular hypertrophy is always a pathology and very often occurs as a manifestation of other disorders of the cardiovascular system. It is quite rare in the general population; it is more often congenital and occurs in children.
The most common cause is congenital defects (tetralogy of Fallot, ventricular septal defect, mitral valve stenosis), lesions of the valve apparatus due to infectious, autoimmune diseases (systemic lupus erythematosus, rheumatism).
Also, an increase in the right side of the heart is observed with:
hypertension of the pulmonary circulation;- chronic obstructive bronchitis;
- bronchial asthma;
- pulmonary form of cystic fibrosis;
- pneumosclerosis;
- emphysema;
- tuberculosis.
There are usually no pronounced complaints. Swelling of the lower extremities, shortness of breath, and cough may occur. Pancreatic hypertrophy is most often diagnosed accidentally.
Right atrium
Right atrial hypertrophy is always a symptom of pre-existing disorders. Most often it occurs with increased pressure in the pulmonary vessels, with hypertension, congenital heart defects, and chronic diseases of the respiratory system. Symptoms are nonspecific.
Diagnostics
It is impossible to make such a diagnosis on your own. Diagnosis of hypertrophic changes in the heart includes several stages. At the initial appointment, the doctor, using objective research methods, can predict the disease.
Using percussion (tapping with fingers on the anterior chest wall), he determines the shape and size of the heart, assesses their compliance with age and physique. On palpation, he may feel an increased heartbeat between the ribs. Auscultation can detect various noises and increased heart sounds.
What does the treatment consist of?
The initial stage of the treatment process is electrocardiographic diagnostics, which helps to identify the problem. An ultrasound may also be needed.
Due to the fact that hypertrophic changes in the ventricle are not an independent disease, but only a manifestation of some disorder, the maximum therapeutic effect can be achieved only by eliminating the underlying disease.
Drug treatment
In many ways, the treatment regimen depends on the stage of the pathological process. If the problem was identified at the compensated stage, then usually the disorder does not require special treatment. In this case, it is enough to follow certain recommendations to maintain heart function, namely:
- correct work and rest schedule;
- moderate physical exercise without overload;
- normalization of body weight;
- a balanced diet that includes a large amount of vitamins and unsaturated fats;
- giving up bad habits, in particular smoking and alcohol abuse.
Sometimes people with ventricular hypertrophy are given a disability group
In order to prevent further development of cardiac muscle overload, the following medications are prescribed:
- Atenolol or Metoprolol. These drugs restore heart rhythm and also reduce the oxygen demand of cells;
- Diltiazem or Verapamil. Prescribed to maintain normal blood pressure in blood vessels;
- Diroton or Enalapril. Effectively fight high blood pressure and heart failure;
- Losartan, Candesartan - reduce the mass of hypertrophied muscles.
Since the disorder is often accompanied by breathing problems, you will need to use drugs aimed at improving respiratory function:
- bronchodilators are drugs that improve the patency of the bronchi and increase their lumen;
- anti-inflammatory drugs normalize the functioning of the bronchi;
- drugs that reduce high pressure in the pulmonary artery.
The following can be said about the effectiveness of the treatment process:
- the size of the ventricle on the control study is much smaller;
- symptoms of heart failure disappear;
- there is a need to remove disability and restore working capacity;
- hypertensive crises, as well as attacks of angina pectoris and arrhythmia, pass;
- quality of life improves.
Drug therapy copes well with symptoms, but generally does not affect the etiological factor
Surgery
Surgical intervention is a last resort, which is resorted to only after the ineffectiveness of conservative methods or when severe heart defects are associated. The operation is usually performed at an early age. With the help of surgical intervention, a specialist acts on the root cause of the disorder.
Let's consider two main types of surgical intervention:
- aortic valve replacement. The operation is performed in two ways: either the chest is opened - this is a traditional technique, or the femoral artery is punctured - this is a minimally invasive intervention;
- prosthetics of not only the valve, but also the aortic part. Compared to the first type, this procedure is more traumatic and requires serious surgeon skills. In this case, either artificial prostheses or biological ones, made from pig tissue, are used.
Sometimes treatment is only possible after a heart transplant. This is a rather serious procedure that requires a large number of compatibility tests. In addition, even after the operation itself, the use of medications is required that will prevent rejection of the donor organ.
Allergy sufferers should use traditional recipes with caution
Traditional treatment
You should not reassure yourself by thinking that unconventional recipes will save you from the problem; miracles will not happen. It will not be possible to return the ventricles to their previous size and restore their previous function, but still folk recipes help lower blood pressure, strengthen the vascular wall and improve the contractility of the heart muscle.
It is best to buy medicinal plants in a pharmacy chain, where you are confident in the quality, correct collection and drying of the product. Let's look at three popular recipes:
- tincture of lily of the valley. The flowers of the plant should be placed in a dark glass container and filled with vodka. The product should infuse for two weeks. Once the tincture is filtered, it is ready for use. Take twenty drops three times a day;
- garlic tincture with the addition of honey and lemon helps stop atherosclerotic changes in blood vessels;
- St. John's wort decoction. For one hundred grams of dry St. John's wort, two liters of boiling water is used. After straining, you can add a small amount of honey. It is recommended to store in the refrigerator. People with serious liver disorders should not take this decoction.
So, despite the fact that ventricular hypertrophy is not a separate disease, its manifestation must be taken into account in the diagnosis of heart disease and subsequent treatment. The pathological process can lead to serious complications, including cardiac arrest. That is why you should regularly undergo a medical examination, and if you have any alarming symptoms from the heart, do not delay visiting a cardiologist.
Main features of a normal ECG in children
This article presents modern views on ECG diagnostics in pediatrics. The team of authors examined some of the most characteristic changes that distinguish the ECG in childhood.
A normal ECG in children differs from the ECG in adults and has a number of specific features in each age period. The most pronounced differences are observed in young children, and after 12 years, the child’s ECG approaches the cardiogram of an adult.
Features of heart rhythm in children
Childhood is characterized by a high heart rate (HR); newborns have the highest heart rate; as the child grows, it decreases. Children exhibit pronounced lability of heart rate; permissible fluctuations are 15–20% of the average age value. Sinus respiratory arrhythmia is often noted; the degree of sinus arrhythmia can be determined using Table 1.
The main pacemaker is the sinus node, however, acceptable variants of the age norm include the mid-atrial rhythm, as well as migration of the pacemaker through the atria.
Features of the duration of ECG intervals in childhood
Considering that children have a higher heart rate than adults, the duration of ECG intervals, waves and complexes decreases.
Changing the voltage of the QRS complex waves
The amplitude of the ECG waves depends on the individual characteristics of the child: tissue electrical conductivity, chest thickness, heart size, etc. In the first 5–10 days of life, a low voltage of the QRS complex waves is noted, which indicates reduced electrical activity of the myocardium. Subsequently, the amplitude of these waves increases. From infancy to 8 years, a higher amplitude of the waves is detected, especially in the chest leads, this is due to the smaller thickness of the chest, the larger size of the heart relative to the chest and the rotation of the heart around its axes, as well as a greater degree of fit of the heart to the chest. Features of the position of the electrical axis of the heart
In newborns and children in the first months of life, there is a significant deviation of the electrical axis of the heart (EOS) to the right (from 90 to 180°, on average 150°). From the age of 3 months. By the age of 1 year, in most children, the EOS moves to a vertical position (75–90°), but significant fluctuations in the angle are still allowed (from 30 to 120°). By 2 years, 2/3 of children still maintain the vertical position of the EOS, and 1/3 have a normal position (30–70°). In preschoolers and schoolchildren, as well as in adults, the normal position of the EOS predominates, but variants in the form of a vertical (more often) and horizontal (less often) position may be noted.
Such features of the position of the EOS in children are associated with changes in the ratio of masses and electrical activity of the right and left ventricles of the heart, as well as with changes in the position of the heart in the chest (rotations around its axes). In children in the first months of life, anatomical and electrophysiological predominance of the right ventricle is noted. With age, as the mass of the left ventricle increases rapidly and the heart rotates with a decrease in the degree of adhesion of the right ventricle to the surface of the chest, the position of the EOS moves from the right to the normogram. The changes that are occurring can be judged by the changing ratio of the amplitude of the R and S waves in the standard and chest leads on the ECG, as well as by the displacement of the transition zone. Thus, as children grow in standard leads, the amplitude of the R wave in lead I increases, and in lead III it decreases; the amplitude of the S wave, on the contrary, decreases in lead I and increases in lead III. In the chest leads, with age, the amplitude of the R waves in the left chest leads (V4-V6) increases and decreases in leads V1, V2; the depth of the S waves increases in the right chest leads and decreases in the left ones; The transition zone gradually shifts from V5 in newborns to V3, V2 after the 1st year. All this, as well as an increase in the interval of internal deviation in lead V6, reflects the increasing electrical activity of the left ventricle and rotation of the heart around its axes with age.
In newborn children, large differences are revealed: the electrical axes of the P and T vectors are located practically in the same sector as in adults, but with a slight shift to the right: the direction of the P vector is on average 55°, the T vector is on average 70°, while the QRS vector is sharply deviated to the right (on average 150°). The value of the adjacent angle between the electrical axes P and QRS, T and QRS reaches a maximum of 80–100°. This partly explains the differences in the size and direction of the P waves, and especially the T waves, as well as the QRS complex in newborns.
With age, the value of the adjacent angle between the electrical axes of the P and QRS, T and QRS vectors decreases significantly: in the first 3 months. life on average up to 40–50°, in young children – up to 30°, and in preschool age it reaches 10–30°, as in schoolchildren and adults (Fig. 1).
In adults and school-age children, the position of the electrical axes of the total vectors of the atria (vector P) and ventricular repolarization (vector T) relative to the ventricular vector (vector QRS) is in the same sector from 0 to 90°, and the direction of the electrical axis of the vectors P (on average 45 –50°) and T (on average 30–40°) does not differ sharply from the orientation of the EOS (QRS vector on average 60–70°). An adjacent angle of only 10–30° is formed between the electrical axes of the P and QRS, T and QRS vectors. This position of the listed vectors explains the same (positive) direction of the P and T waves with the R wave in most leads on the ECG. Features of teeth intervals and complexes of children's ECG
Atrial complex (P wave). In children, as in adults, the P wave is small (0.5–2.5 mm), with maximum amplitude in standard leads I and II. In most leads it is positive (I, II, aVF, V2-V6), in lead aVR it is always negative, in leads III, aVL, V1 it can be smoothed, biphasic or negative. In children, a slightly negative P wave in lead V2 is also allowed.
The greatest features of the P wave are observed in newborns, which is explained by increased electrical activity of the atria due to the conditions of intrauterine circulation and its postnatal restructuring. In newborns, the P wave in standard leads, compared to the size of the R wave, is relatively high (but in amplitude no more than 2.5 mm), pointed, and sometimes may have a small notch at the apex as a result of non-simultaneous coverage of the right and left atria by excitation (but not more than 0 .02–0.03 s). As the child grows, the amplitude of the P wave decreases slightly. With age, the ratio of the size of the P and R waves in standard leads also changes. In newborns it is 1: 3, 1: 4; as the amplitude of the R wave increases and the amplitude of the P wave decreases, this ratio by 1–2 years decreases to 1: 6, and after 2 years it becomes the same as in adults: 1: 8; 1: 10. The smaller the child, the shorter the duration of the P wave. It increases on average from 0.05 s in newborns to 0.09 s in older children and adults.
Features of the PQ interval in children. The duration of the PQ interval depends on heart rate and age. As children grow, there is a noticeable increase in the duration of the PQ interval: on average from 0.10 s (no more than 0.13 s) in newborns to 0.14 s (no more than 0.18 s) in adolescents and 0.16 s in adults (no more than 0.20 s).
Features of the QRS complex in children. In children, the time of ventricular excitation coverage (QRS interval) increases with age: on average from 0.045 s in newborns to 0.07–0.08 s in older children and adults.
In children, as in adults, the Q wave is recorded inconsistently, more often in II, III, aVF, left chest leads (V4-V6), less often in I and aVL leads. In lead aVR, a deep and wide Q wave of the Qr type or QS complex is detected. In the right chest leads, Q waves, as a rule, are not recorded. In young children, the Q wave in standard leads I and II is often absent or weakly expressed, and in children of the first 3 months. – also in V5, V6. Thus, the frequency of registration of the Q wave in various leads increases with the age of the child.
In standard lead III in all age groups, the Q wave is also small on average (2 mm), but can be deep and reach up to 5 mm in newborns and infants; in early and preschool age - up to 7–9 mm and only in schoolchildren it begins to decrease, reaching a maximum of 5 mm. Sometimes, in healthy adults, a deep Q wave is recorded in standard lead III (up to 4–7 mm). In all age groups of children, the size of the Q wave in this lead can exceed 1/4 of the size of the R wave.
In lead aVR, the Q wave has a maximum depth, which increases with the age of the child: from 1.5–2 mm in newborns to 5 mm on average (with a maximum of 7–8 mm) in infants and at an early age, up to 7 mm on average (with a maximum of 11 mm) in preschool children and up to 8 mm on average (with a maximum of 14 mm) in schoolchildren. The duration of the Q wave should not exceed 0.02–0.03 s.
In children, as well as in adults, R waves are usually recorded in all leads, only in aVR they can be small or absent (sometimes in lead V1). There are significant fluctuations in the amplitude of the R waves in different leads from 1–2 to 15 mm, but the maximum value of the R waves in standard leads is up to 20 mm, and in the chest leads up to 25 mm. The smallest magnitude of R waves is observed in newborns, especially in the strengthened unipolar and chest leads. However, even in newborns, the amplitude of the R wave in standard lead III is quite large, since the electrical axis of the heart is deviated to the right. After 1 month the amplitude of the RIII wave decreases, the size of the R waves in the remaining leads gradually increases, especially noticeably in the II and I standard and in the left (V4-V6) chest leads, reaching a maximum at school age.
In the normal position of the EOS, high R waves with a maximum of RII are recorded in all limb leads (except aVR). In the chest leads, the amplitude of the R waves increases from left to right from V1 (r wave) to V4 with a maximum of RV4, then decreases slightly, but the R waves in the left chest leads are higher than in the right ones. Normally, in lead V1, the R wave may be absent, and then a QS-type complex is recorded. In children, the QS type complex is also rarely allowed in leads V2, V3.
In newborns, electrical alternans is allowed - fluctuations in the height of the R waves in the same lead. Variants of the age norm also include respiratory alternation of ECG waves.
In children, deformation of the QRS complex in the form of the letters “M” or “W” in the III standard and V1 leads is often found in all age groups, starting from the neonatal period. In this case, the duration of the QRS complex does not exceed the age norm. Splitting of the QRS complex in healthy children in V1 is referred to as “slow excitation syndrome of the right supraventricular crest” or “incomplete block of the right bundle branch.” The origin of this phenomenon is associated with the excitation of the hypertrophied right “supraventricular scallop” located in the region of the conus pulmonary of the right ventricle, which is the last to be excited. The position of the heart in the chest and the electrical activity of the right and left ventricles changing with age are also important.
The internal deviation interval (time of activation of the right and left ventricles) in children changes as follows. The activation time of the left ventricle (V6) increases from 0.025 s in newborns to 0.045 s in schoolchildren, reflecting an accelerated increase in the mass of the left ventricle. The activation time of the right ventricle (V1) remains virtually unchanged with the child’s age, amounting to 0.02–0.03 s.
In young children, a change in the localization of the transition zone occurs due to a change in the position of the heart in the chest and a change in the electrical activity of the right and left ventricles. In newborns, the transition zone is located in lead V5, which characterizes the dominance of the electrical activity of the right ventricle. At the age of 1 month. the transition zone shifts to leads V3, V4, and after 1 year it is localized in the same place as in older children and adults - in V3 with fluctuations V2-V4. Together with an increase in the amplitude of the R waves and deepening of the S waves in the corresponding leads and an increase in the activation time of the left ventricle, this reflects an increase in the electrical activity of the left ventricle.
Both in adults and in children, the amplitude of the S waves in different leads varies widely: from absence in a few leads to a maximum of 15–16 mm, depending on the position of the EOS. The amplitude of the S waves changes with the age of the child. Newborn children have the smallest depth of S waves in all leads (from 0 to 3 mm), except standard I, where the S wave is quite deep (on average 7 mm, maximum up to 13 mm).
In children older than 1 month. the depth of the S wave in the first standard lead decreases and subsequently in all leads from the limbs (except aVR) S waves of small amplitude (from 0 to 4 mm) are recorded, just like in adults. In healthy children, in leads I, II, III, aVL and aVF, the R waves are usually larger than the S waves. As the child grows, there is a deepening of the S waves in the chest leads V1-V4 and in lead aVR, reaching a maximum value at high school age. In the left chest leads V5-V6, on the contrary, the amplitude of the S waves decreases, often they are not recorded at all. In the chest leads, the depth of the S waves decreases from left to right from V1 to V4, having the greatest depth in leads V1 and V2.
Sometimes in healthy children with an asthenic physique, with the so-called. “hanging heart”, S-type ECG is recorded. In this case, the S waves in all standard (SI, SII, SIII) and chest leads are equal to or exceed the R waves with reduced amplitude. It is believed that this is due to the rotation of the heart around the transverse axis with the apex posteriorly and around the longitudinal axis with the right ventricle forward. In this case, it is almost impossible to determine the angle α, so it is not determined. If the S waves are shallow and there is no shift of the transition zone to the left, then we can assume that this is a normal variant; more often, the S-type ECG is determined by pathology.
The ST segment in children, as well as in adults, should be on the isoline. The ST segment may shift up and down up to 1 mm in the limb leads and up to 1.5–2 mm in the chest leads, especially in the right ones. These shifts do not mean pathology if there are no other changes on the ECG. In newborns, the ST segment is often not expressed and the S wave, when reaching the isoline, immediately turns into a gently rising T wave.
In older children, as in adults, the T waves are positive in most leads (standard I, II, aVF, V4-V6). In standard III and aVL leads, T waves can be smoothed, biphasic or negative; in the right chest leads (V1-V3) are often negative or smoothed; in lead aVR – always negative.
The greatest differences in T waves are observed in newborns. In their standard leads, the T waves are low-amplitude (from 0.5 to 1.5–2 mm) or smoothed. In a number of leads, where T waves in children of other age groups and adults are normally positive, in newborns they are negative, and vice versa. Thus, in newborns there may be negative T waves in standard I, II, in strengthened unipolar and in the left chest leads; may be positive in standard III and right chest leads. By 2–4 weeks. life, an inversion of T waves occurs, i.e. in the I, II standard, aVF and left chest leads (except V4) they become positive, in the right chest and V4 - negative, in the III standard and aVL they can be smoothed, biphasic or negative.
In subsequent years, negative T waves persist in lead V4 until 5–11 years, in lead V3 – up to 10–15 years, in lead V2 – up to 12–16 years, although in leads V1 and V2 negative T waves are allowed in some cases and in healthy adults.
After 1 month During life, the amplitude of T waves gradually increases, amounting in young children from 1 to 5 mm in standard leads and from 1 to 8 mm in chest leads. In schoolchildren, the size of T waves reaches the level of adults and ranges from 1 to 7 mm in standard leads and from 1 to 12–15 mm in chest leads. The T wave is largest in lead V4, sometimes in V3, and in leads V5, V6 its amplitude decreases.
The QT interval (ventricular electrical systole) makes it possible to assess the functional state of the myocardium. The following features of electrical systole in children can be identified, reflecting the electrophysiological properties of the myocardium changing with age.
The duration of the QT interval increases as the child grows from 0.24–0.27 s in newborns to 0.33–0.4 s in older children and adults. With age, the relationship between the duration of electrical systole and the duration of the cardiac cycle changes, which is reflected by the systolic index (SP). In newborn children, the duration of electrical systole occupies more than half (SP = 55–60%) of the duration of the cardiac cycle, and in older children and adults – 1/3 or slightly more (37–44%), i.e., with age, SP decreases.
With age, the ratio of the duration of the electrical systole phases changes: the excitation phase (from the beginning of the Q wave to the beginning of the T wave) and the recovery phase, i.e., rapid repolarization (duration of the T wave). In newborns, more time is spent on recovery processes in the myocardium than on the excitation phase. In young children, these phases take approximately the same time. In 2/3 of preschoolers and most schoolchildren, as well as in adults, more time is spent on the arousal phase.
Features of ECG in different age periods of childhood
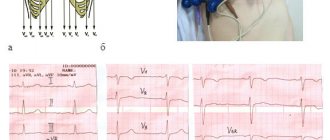
Newborn period (Fig. 2).
1. In the first 7–10 days of life, there is a tendency towards tachycardia (heart rate 100–120 beats/min), followed by an increase in heart rate to 120–160 beats/min. Pronounced heart rate lability with large individual fluctuations. 2. A decrease in the voltage of the QRS complex waves in the first 5–10 days of life with a subsequent increase in their amplitude. 3. Deviation of the electrical axis of the heart to the right (angle α 90–170°). 4. The P wave is relatively larger (2.5–3 mm) in comparison with the teeth of the QRS complex (P/R ratio 1: 3, 1: 4), often pointed. 5. PQ interval does not exceed 0.13 s. 6. The Q wave is unstable, as a rule, absent in standard I and in the right chest leads (V1-V3), it can be deep up to 5 mm in standard III and aVF leads. 7. The R wave in standard lead I is low, and in standard lead III it is high, with RIII > RII > RI, high R waves in aVF and right precordial leads. The S wave is deep in standard I, II, aVL and in the left precordial leads. The above reflects the deviation of the EOS to the right. 8. Low amplitude or smoothness of T waves in the limb leads is noted. In the first 7–14 days, the T waves are positive in the right chest leads, and in the I and left chest leads they are negative. By 2–4 weeks. life, an inversion of the T waves occurs, i.e. in the I standard and left pectorals they become positive, and in the right pectorals and V4 they become negative, remaining so in the future until school age.
Infant age: 1 month. – 1 year (Fig. 3).
1. Heart rate decreases slightly (on average 120–130 beats/min) while maintaining rhythm lability. 2. The voltage of the QRS complex teeth increases, often higher than in older children and adults, due to the smaller thickness of the chest. 3. In most infants, the EOS goes into a vertical position, some children have a normogram, but significant fluctuations in the α angle are still allowed (from 30 to 120°). 4. The P wave is clearly expressed in standard leads I and II, and the ratio of the amplitude of the P and R waves decreases to 1:6 due to an increase in the height of the R wave. 5. The duration of the PQ interval does not exceed 0.13 s. 6. The Q wave is recorded inconsistently and is often absent in the right precordial leads. Its depth increases in standard III and aVF leads (up to 7 mm). 7. The amplitude of the R waves in standard I, II and in the left thoracic (V4-V6) leads increases, and in standard III it decreases. The depth of the S waves decreases in standard I and in the left chest leads and increases in the right chest leads (V1-V3). However, in VI, the amplitude of the R wave, as a rule, still prevails over the magnitude of the S wave. The listed changes reflect the shift of the EOS from the correct position to the vertical position. 8. The amplitude of the T waves increases, and by the end of the 1st year the ratio of the T and R waves is 1: 3, 1: 4.
ECG in young children: 1–3 years (Fig. 4).
1. Heart rate decreases to an average of 110–120 beats/min, and in some children sinus arrhythmia appears. 2. The high voltage of the QRS complex teeth remains. 3. EOS position: 2/3 of children maintain a vertical position, and 1/3 have a normogram. 4. The ratio of the amplitude of the P and R waves in standard leads I and II decreases to 1: 6, 1: 8 due to the growth of the R wave, and after 2 years it becomes the same as in adults (1: 8, 1: 10) . 5. The duration of the PQ interval does not exceed 0.14 s. 6. Q waves are often shallow, but in some leads, especially in standard III, their depth becomes even greater (up to 9 mm) than in children of the 1st year of life. 7. The same changes in the amplitude and ratio of the R and S waves that were noted in infants continue, but they are more pronounced. 8. There is a further increase in the amplitude of the T waves, and their ratio with the R wave in leads I and II reaches 1: 3 or 1: 4, as in older children and adults. 9. Negative T waves remain (options: biphasic, smooth) in standard III and right chest leads up to V4, which is often accompanied by a downward shift of the ST segment (up to 2 mm).
ECG in preschool children: 3–6 years (Fig. 5).
1. Heart rate decreases to an average of 100 beats/min, and moderate or severe sinus arrhythmia is often recorded. 2. The high voltage of the QRS complex teeth remains. 3. EOS is normal or vertical, and very rarely there is a deviation to the right and a horizontal position. 4. PQ duration does not exceed 0.15 s. 5. Q waves in various leads are recorded more often than in previous age groups. The depth of the Q waves in standard III and aVF leads remains relatively large (up to 7–9 mm) compared to that in older children and adults. 6. The ratio of the size of the R and S waves in standard leads changes towards an even greater increase in the R wave in standard leads I and II and a decrease in the depth of the S wave. 7. The height of the R waves in the right chest leads decreases, and in the left chest leads it increases. The depth of the S waves decreases from left to right from V1 to V5 (V6). ECG in schoolchildren: 7–15 years (Fig. 6).
The ECG of schoolchildren is close to the ECG of adults, but there are still some differences:
1. Heart rate decreases on average in younger schoolchildren to 85–90 beats/min, in older schoolchildren – to 70–80 beats/min, but heart rate fluctuations within wide limits are noted. Moderate and severe sinus arrhythmia is often recorded. 2. The voltage of the QRS complex teeth decreases somewhat, approaching that of adults. 3. Position of the EOS: more often (50%) – normal, less often (30%) – vertical, rarely (10%) – horizontal. 4. The duration of ECG intervals approaches that of adults. The PQ duration does not exceed 0.17–0.18 s. 5. The characteristics of the P and T waves are the same as in adults. Negative T waves persist in lead V4 up to 5–11 years, in V3 – up to 10–15 years, in V2 – up to 12–16 years, although negative T waves in leads V1 and V2 are also allowed in healthy adults. 6. The Q wave is recorded inconsistently, but more often than in young children. Its value becomes smaller than in preschool children, but in lead III it can be deep (up to 5–7 mm). 7. The amplitude and ratio of the R and S waves in various leads approach those in adults. Conclusion
To summarize, we can highlight the following features of the children's electrocardiogram: 1. Sinus tachycardia, from 120–160 beats/min during the newborn period to 70–90 beats/min by high school age. 2. Greater variability of heart rate, often sinus (respiratory) arrhythmia, respiratory electrical alteration of QRS complexes. 3. The norm is considered to be mid- and lower-atrial rhythm and migration of the pacemaker through the atria. 4. Low QRS voltage in the first 5–10 days of life (low electrical activity of the myocardium), then an increase in the amplitude of the waves, especially in the chest leads (due to the thin chest wall and the large volume occupied by the heart in the chest). 5. Deviation of the EOS to the right up to 90–170º during the newborn period, by the age of 1–3 years – transition of the EOS to a vertical position, by adolescence in about 50% of cases – normal EOS. 6. Short duration of intervals and waves of the PQRST complex with a gradual increase with age to normal limits. 7. “Syndrome of delayed excitation of the right supraventricular crest” – splitting and deformation of the ventricular complex in the form of the letter “M” without increasing its duration in leads III, V1. 8. Pointed high (up to 3 mm) P wave in children in the first months of life (due to the high functional activity of the right side of the heart in the prenatal period). 9. Often – deep (amplitude up to 7–9 mm, more than 1/4 of the R wave) Q wave in leads III, aVF in children up to adolescence. 10. Low amplitude of T waves in newborns, increasing by the 2nd–3rd year of life. 11. Negative, biphasic or smoothed T waves in leads V1-V4, persisting until the age of 10–15 years. 12. Shift of the transition zone of the chest leads to the right (in newborns - in V5, in children after the 1st year of life - in V3-V4) (Fig. 2–6).
Bibliography
: 1. Heart disease: A guide for doctors / ed. R.G. Oganova, I.G. Fomina. M.: Litterra, 2006. 1328 p. 2. Zadionchenko V.S., Shekhyan G.G., Shchikota A.M., Yalymov A.A. Practical guide to electrocardiography. M.: Anaharsis, 2013. 257 pp.: ill. 3. Isakov I.I., Kushakovsky M.S., Zhuravleva N.B. Clinical electrocardiography. L.: Medicine, 1984. 4. Kushakovsky M.S. Cardiac arrhythmias. St. Petersburg: Hippocrates, 1992. 5. Orlov V.N. Guide to electrocardiography. M.: Medical Information Agency, 1999. 528 p. 6. Guide to electrocardiography / ed. h. Doctor of Science RF, prof. V.S. Zadionchenko. Saarbrucken, Germany. Lap Lambert Academic Publishing GmbH&Co. KG, 2011. P. 323. 7. Fazekas T.; Liszkai G.; Rudas LV Electrocardiographic Osborn wave in hypothermia // Orv. Hetil. 2000. Oct. 22.Vol. 141(43). P. 2347–2351. 8. Yan GX, Lankipalli RS, Burke JF et al. Ventricular repolarization components on the electrocardiogram: Cellular basis and clinical significance // J. Am. Coll. Cardiol. 2003. No. 42. P. 401–409.