P wave
The sinus node is located at the junction of the vena cava. During depolarization, the impulse travels through the right atrium, thus forming the ascending limb of the P wave. Thus, if any changes occur in the ascending limb of the P wave, then the problem is in the right atrium.
Next, the impulse travels through the left atrium; on the ECG it is the descending limb of the P wave.
Typically, the ascending and descending limbs of the P wave are symmetrical.
The P wave is responsible for the atria:
- it is always positive, except for those leads where all the waves are negative (aVR, V1)
- height up to 2 mm
- duration up to 0.1 sec
If the P wave grows in the right knee, this is hypertrophy of the right atrium, if in the left knee, this is hypertrophy of the left atrium.
If the P wave is reduced, this indicates atrial dystrophy (decreased atrial myocardial mass).
There is no P wave – the sinus node is not working.
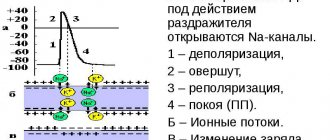
The impulse then goes to the AV junction. There is no depolarization or repolarization. On the ECG this corresponds to the PQ interval - resting potential.
The impulse then goes to the interventricular septum.
Why do an ECG?
Analysis of the state of the CT segment in the electrocardiogram remains a very relevant method of modern diagnostics. Using an ECG, you can detect cardiac pathologies in the early stages and begin their therapy. Therapeutic practice shows that the treatment and prognosis of many of these diseases depend on the stage of pathology at which they are diagnosed.
It is possible to assess how strongly the CT segment has shifted only in combination with other cardiac parameters. Depression or elevation in itself does not necessarily indicate pathology; it may be part of the norm.
When considering the results of electrocardiography, one cannot ignore the symptoms that appear. Displacement of the CT segment may be associated with non-coronarogenic changes in the myocardium.
Important! In rare cases, segment displacement may be a sign of acute coronary syndrome. This requires emergency medical attention.
S wave
S wave:
- depth up to 8-12 mm
- duration 0.03 sec
The S wave is the potential being tested; this is the time when the ventricles are completely engulfed in excitation. It has no independent meaning.
The QRS complex is of great importance, which corresponds to intraventricular conduction equal to 0.1 sec, and with hypertrophy it can be up to 0.12 sec. If the QRS complex is more than 0.12 seconds, this is an intraventricular block or a violation of intraventricular conduction.
Next, the depolarization process is completed; on the electrocardiogram this corresponds to the ST interval. This means that the cell membrane is completely recharged.
Recommendations for interpreting electrocardiograms
To correctly establish a diagnosis and prescribe effective treatment, it is important for a cardiologist to carefully read the electrocardiogram. There are some rules, taking into account which you can help the patient efficiently.
First of all, the ability of the heart to conduct electrical impulses is analyzed. The frequency and rhythm of the pulse are calculated, and the regularity of heart contractions is assessed. The cardiologist then pays attention to the work of the pacemaker and determines how well the impulses travel along the conduction pathways of the heart.
After these studies, the cardiologist evaluates the position of the electrical axis and examines the rotation of the heart around the longitudinal, transverse and anteroposterior axis. At the same stage, the P wave is assessed.
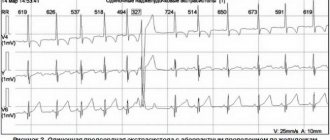
The next stage of deciphering the electrocardiogram is to consider the state of the QRS-T complex. When assessing the ST segment, the J point (the moment the S wave transitions to the ST segment) is important.
The shape of the arc that the J point forms to the end of the ST segment determines the presence of pathology. If it is concave, then the deviation is benign. Convex is a sign of myocardial ischemia.
T wave
T wave:
- always positive
- height 2-6 mm
Responsible for recovery processes. Any changes in the T wave indicate a restoration disorder. If the T wave is changed throughout the electrocardiogram, this means the process is diffuse, if in one place it is focal.
Tags: P wave, ECG waves, ECG intervals, normal ECG, cardiovascular disease, ECG
Causes of ST segment elevation
Ischemic injury can occur as a result of various clinical conditions, which will be discussed in detail below.
Early repolarization syndrome
Most authors consider the presence of this syndrome to be a normal variant. This phenomenon may not manifest itself clinically and can only be determined by ECG results. Elevation of the ST segment along with a change in the electrical axis of the heart (it rotates counterclockwise) are the main signs of this syndrome.
Prinzmetal's angina
Angina consists of an attack of pain in the chest. This symptom is typical for patients with coronary heart disease. It usually occurs in response to emotional stress or physical activity.
However, in approximately 25% of the observed patients, pain syndrome also manifested itself at rest. The pain of angina is short-lived and can be relieved by taking nitrates, which distinguishes angina from myocardial infarction.
If a cardiogram is taken during an attack of angina, a change in the T wave will be observed, as well as a shift of the ST segment below the isoline.
ST segment elevation, combined with the absence of other changes recorded on the ECG during an attack, is a specific sign of Prinzmetal's angina. This is a rare form of angina. It has no other electrocardiographic signs, but to make a diagnosis it is necessary to reconcile the ECG data with the clinical manifestations in the history.
Myocardial infarction with ST segment elevation.
Heart attacks are the most common diseases accompanied by elevation of the segment in question. Myocardial infarction is a pathological condition based on necrosis (death) of a section of the heart muscle.
The cause of a heart attack is most often a violation of the blood supply to the heart as a result of blocking the lumen of a vessel with an atherosclerotic plaque, a blood clot, a rupture of the vessel wall and a number of other reasons.
ST segment elevation on the ECG is not a specific sign of a heart attack and will only be observed during the damage stage (this sign remains intact from several hours to several days).
Depending on the stage of development of the pathological process, other signs will be observed, including a change in the T wave, as well as the appearance of a pathological Q wave. There is also a form of myocardial infarction that is not accompanied by ST segment elevation.
ST segment elevation on ECG
In acute myocardial infarction, ST segment elevation can be of different shapes: dome-shaped, plateau-shaped, oblique-shaped. It should not be forgotten that ST segment depression will be observed in reciprocal (mirror) leads.
This is due to the peculiarities of the application of electrodes and the propagation of excitation during ECG recording. To make a diagnosis of myocardial infarction at the initial stage of diagnosis, clinical symptoms and changes on the ECG are sufficient.
Heart aneurysm
An aneurysm is an abnormal bulging of a section of the heart wall. During the heart's contraction, the aneurysm protrudes further outward. As a rule, such a bulge often forms as a result of myocardial infarction, on days 20-21, at the site of necrosis of muscle fibers. Aneurysm can be either acute or chronic.
The changes described above on the cardiogram during an aneurysm are associated with the presence of damage during myocardial infarction. A number of authors believe that during the formation of an aneurysm, the damage is still ongoing, and therefore elevation is observed.
A distinctive feature of the electrocardiogram in this pathological condition is that the ST segment remains permanently elevated, and other changes in the electrocardiogram characteristic of an aneurysm also do not change over time; the ECG takes on the appearance of a “frozen” curve. However, the absence of persistent ST segment elevation on the ECG does not at all exclude the presence of this pathology.
Acute pericarditis
Pericarditis is inflammation of the pericardium (the outer lining of the heart). It can occur as a result of various infectious diseases, tumors, systemic connective tissue diseases, surgical interventions and more. ECG signs of pericarditis resemble the acute stage of myocardial infarction.
ST segment elevation on the ECG of a patient with pericarditis is the earliest sign of this pathology. The criterion for excluding myocardial infarction is the leads in which this picture is observed. During a heart attack, changes affect only those leads that reflect the processes occurring in the affected area of the myocardium.
The pericardium covers the entire heart, so changes in the ECG affect a larger number of leads (up to all in case of extensive damage). With pericarditis, there is no pathological Q wave.
Changes in the PR segment are also characteristic, and negative T waves may appear.
Brugada syndrome
Severe hereditary pathology, represented by a combination of syncope (fainting) conditions and sudden cardiac death in patients who do not have organic disorders of the cardiovascular system.
The main electrocardiographic signs of this condition are various types of arrhythmia (ventricular tachycardia, ventricular fibrillation), however, ST segment elevation on the ECG with this pathology is also recorded quite often.
Myocardial damage not associated with infarction (myocarditis, LV tumor, traumatic ventricular injury)
Myocarditis is an inflammatory disease of the muscular lining of the heart. Can be caused by exposure to infectious (viruses, bacteria) and non-infectious (eg, traumatic) agents.
The electrocardiographic picture of myocarditis is variable and often nonspecific. ST segment elevation on the ECG with myocarditis can be found quite often. It can be combined with signs of rhythm and conduction disturbances and even with a pathological Q wave, due to which myocarditis can be confused with myocardial infarction.
Hyperkalemia
Normal serum potassium levels are within the range of 3.5-5 mmol/l. An increase in potassium levels of more than 5 mmol/l is dangerous and can be fatal.
Characteristic electrocardiographic signs of hyperkalemia are:
- Enlargement of the T wave, its sharpness;
- ST segment elevation;
- Prolongation of the PR interval, decrease in the amplitude of the T wave.
- Extension
With hypokalemia, the ST segment, on the contrary, is located below the isoline.
Systemic hypothermia (hypothermia)
The peculiarity of the ST segment in this condition is that a hill-like rise occurs at the beginning of the ST complex, that is, in fact, the J point is elevated. This phenomenon is called the Osborne wave. When warmed up, the waves disappear.
Taking medications
When taking cardiac glycosides (for example, Digoxin), a trough-shaped change in the ST segment is possible (both elevation and depression can occur).
In addition to the above nosologies, ST segment elevation on the ECG can also be observed with hypertrophy of the left ventricular wall, as well as with blockade of the left bundle branch.