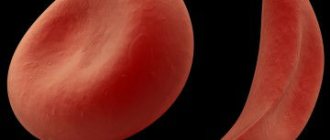
Red blood cell distribution index (RDW) is a very important factor during a complete blood count. This indicator shows the size and shape of red blood cells.
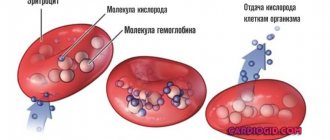
Red blood cells perform the transport function, thereby assisting in the penetration of oxygen into all tissues and organs and at the same time taking away toxins and carbon dioxide accumulated in the cells. In their normal state, red blood cells are approximately the same size, which allows them to quickly stick together, forming blood clots.
The indicator of red blood cells in the blood may reflect the presence of pathological processes in the body, especially if the sizes of these cells vary significantly. Next, we will talk about in what situations the erythrocyte distribution index decreases, how this manifests itself and what it indicates.
Reduced RDW: norm and pathology
A person in good health has red blood cells of the same shape, density and color. In case of deviation, especially in the presence of autoimmune diseases or oncology, the failure occurs at the level of microcells, when young cells do not receive a certain number of components, which, in fact, inhibits their performance. Thus, anemia occurs - a pathology during which the body does not receive the required amount of oxygen, in other words, the metabolic function in red blood cells is disrupted.
Treatment process
During the treatment process, it is important to exclude the influence of the etiological factor that provoked the onset of the disease. If hypoxia is detected in the patient, oxygen treatment is necessary. If the level of red blood cells in the bone marrow has increased, it is necessary to treat with a blood replacement solution and glucose. In case of advanced disease, the patient must be prescribed medications that thin the blood. This will help prevent the formation of blood clots. During the treatment process, it is important to follow the diet prescribed by the attending physician. Physicians often prescribe bloodletting - this will help reduce hemoglobin levels. When using oxygen inhalation, the functioning of oxygen transport into human cells is restored. Specific medications are prescribed by the doctor depending on the identified disease and the general health of the patient.
What does RDW mean in a blood test?
During a general blood test, the erythrocyte distribution index is determined. If the presence of a specific disease is suspected, a blood test is prescribed to determine only this indicator.
Most often, the width of the distribution of red blood cells by volume is determined together with the MCV indicator. This is the average volume of red blood cells. This happens because these indices (in quantity and volume) are closely related to each other and help in determining the type of anemia.
It happens that the erythrocyte distribution index is reduced. What does it mean? The thing is that for a qualitative judgment about the state of red blood cells, not only their concentration in the blood is important, but also their shape. An increased distribution of red blood cells is observed in 1 out of 10,000 cases, but if the RDW index is reduced, which is much less common, we are talking about the presence of serious problems in the human body.
A blood test to determine the erythrocyte distribution index can be carried out both during medical examinations (routinely) and as prescribed, if there are suspicions of any abnormalities in the hematopoietic function. The analysis is required before surgery, during pregnancy and in childhood.
Classification of anisocytosis
There are four degrees:
- first (minor anisocytosis) – microcytes and macrocytes make up 30-50%;
- second (moderate) – 50-70%;
- third (pronounced) – above 70%;
- fourth (sharply expressed) - almost all red cells have a size different from the normal value.
Depending on the increase in the number of certain forms of red blood cells, there are:
- microcytosis - an increase in the number of small cells;
- macrocytosis – increase in the number of macrocytes;
- mixed - an increase in the number of both small and large cells.
Microcytosis is usually observed in the following conditions:
- iron deficiency anemia;
- in case of lead poisoning;
- thalassemia;
- sideroblastic anemia;
- with anemia associated with chronic bleeding;
- for some malignant diseases.
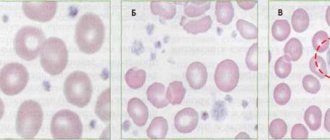
With anisocytosis, red blood cells of both small and large sizes are present in the blood
Macrocytosis may be normal or pathological. In the first case, we are talking about anisocytosis of newborns in the first two weeks of life; by two months the condition is normalized. Pathological macrocytosis is due to the following reasons:
- impaired DNA synthesis, which may be associated with the use of certain medications, myelodysplasia, erythroleukemia, folic acid and cobalamin deficiency.
- pathology of red blood cell membrane lipids in liver diseases, alcoholism, hypothyroidism, after removal of the spleen.
In mixed anisocytosis, both microcytes and macrocytes can predominate. In the first case, as a rule, hypochromic anemia occurs. If macrocytes predominate, then the possibility of B12 deficiency or pernicious anemia cannot be excluded.
Why is it necessary to do an RDW analysis?
It was already mentioned above that the index of distribution of red blood cells in the blood makes it possible to conduct a qualitative assessment of the composition of red blood cells, taking into account their size.
But why is this necessary? The thing is that these cells are very similar to each other, which gives them the opportunity to replace each other or form blastulas. An increase in cell size entails an increased need for nutrition and, in addition, this means that their life expectancy is reduced. All this directly affects the overall indicator of red blood cells in the blood and the human condition.
When a large number of red blood cells die, iron is released and more bilirubin becomes available, which puts increased stress on the liver, and as a result, it cannot process these substances.
The RDW index is directly related to the pathological process, during which the dimensions of erythrocytes change (anisocytosis). This condition is a complex chemical process that causes all blood cells to suffer.
general information
Unfortunately, situations where the width of the distribution of red blood cells is reduced are not uncommon.
This means that the red blood cells present in human blood differ significantly from each other. A decrease in their size indicates a pathologically slow process of blood formation.
Against this background, degenerative red cells are often formed, to which the human body reacts accordingly.
Indicators
When a specialist takes a general blood test from a patient, both the total number of red blood cells and the hemoglobin concentration are checked.
If the distribution of red blood cells by volume decreases, this indicates oxygen starvation. If the indicators are too high, capillaries become clogged.
Red blood cell indices look like this:
- The standard red blood cell volume is MCV.
- Standard hemoglobin concentration is MCHC.
- Standard hemoglobin content (in 1 red blood cell) - MCH.
These parameters are determined using special equipment. Today, a hematology analyzer also shows the width of erythrocyte distributions. This indicator is measured as a percentage. Indicators ranging from 11.5 to 14.5 are considered normal.
Reasons for the decline
If the width of the distribution of red blood cells is reduced, then medical experts indicate the onset of erythopenia. This abnormal condition develops due to the destruction of red blood cells. This happens if a person has one or another hereditary pathology.
How is it calculated?
The RDW indicator is calculated as a percentage, the norm of which is considered to be the limit from 11.5 to 14.8. The red blood cell distribution index is determined using a mathematical equation that represents the ratio of modified red blood cells to their total mass.
Nowadays, laboratories use computer technologies that make it possible to calculate the percentage of deviation from the established norm. The calculation results are presented in the form of a histogram depicting a curve that indicates probable changes in the dimensions of red blood cells.
Ways to reduce RWD
First of all, it is necessary to treat the underlying disease - the cause of increased RDW values. Below are additional options that can help you improve your health and reduce your RDW.
Balanced diet
Eating a healthy and balanced diet helps prevent nutritional deficiencies. It is especially important that the diet contains the recommended amounts of iron, folic acid and vitamin B12. [R, R, R] Correcting nutritional deficiencies can improve blood cell production and lower RDW values.
Reduce alcohol consumption
Reducing alcohol consumption may help reduce damage to red blood cells. [R,R] In addition, alcohol also reduces the absorption of nutrients such as vitamin B12 and folic acid, which are essential for the production of red blood cells. [r, r]
More physical activity
People who do little or no physical activity show higher levels of RDW. [r, r]
Exercise, including light intensity exercise, has been shown in research to improve RDW scores. [r, r, r]
In a study of more than 8,000 people, as the amount of exercise time per week increased, the risk of showing increased levels of RDW decreased by 11%. [R]
Quit smoking
Smoking increases oxidative stress. Higher RDWs are identified in smokers and are associated with the number of cigarettes smoked per day as well as the duration of smoking. [R]
Getting enough sleep
In a study of 17,500 adults, those who slept 7-8 hours had the lowest RDW values. People who slept less than 6 hours, about 10 hours, and more than 10 hours showed increases in RDW of 23%, 29%, and 67%, respectively. [R]
Normal indicators
The norms of the erythrocyte distribution index depend on gender, age and the presence of certain conditions that occur in the human body. For children under one year of age, the normal rate is 11.5-18.7%. At one year of age and older, the values tend to the generally accepted norm of 11.5-14.5%.
For the female half of humanity, the upper limit shifts to 15.5%, since their hormonal levels change too often: during pregnancy, lactation, taking oral contraceptives, menopause.
For analysis, blood is taken on an empty stomach in the morning (before 9 am). It is very important that before this procedure the person does not take any medications and is in a balanced internal state.
Hemoleucograma
Blood hemoglobinReference values
Children
| Concentration | |
| 1st month | 135-165 g/l |
| 1st year | 110-140 g/l |
| 2-12 years | 119-155 g/l |
| Adults | |
| Men | 140-180 g/l |
| Women | 115-160 g/l |
Interpretation of the results obtained
Increase ↑ Hb
- Polycythemia;
- Erythrocytosis;
- Dehydration;
- Congenital or acquired cyanosis;
- Chronic heart and lung diseases;
- Renal cyst;
- Erythropoietin-producing tumors;
- Erythremia.
A false increase in results can be observed with hypertriglyceridemia due to serum turbidity, leukocytosis if the leukocyte count exceeds 25 x 109/l, the presence of HbC or HbS, easily precipitated globulins, for example, with myeloma or Waldenström's macroglobulinemia, progressive liver diseases, in heavy smokers due to formation of functionally inactive HbCO.
Decrease ↓ Hb
- Acute blood loss;
- Overhydration;
- Anemia.
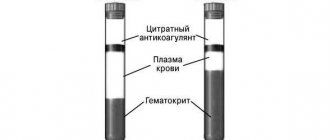
Hematocrit
Reference values
| Men | 40-48% |
| Women | 36-42% |
Interpretation of the results obtained
Increase ↑ Ht
- Erythrocytosis: chronic lung diseases, altitude sickness, polycystic kidney disease, kidney tumors, accompanied by increased formation of erythropoietin;
- Condition of decreased volume of blood volume: peritonitis, burn disease;
- Dehydration: profuse diarrhea, uncontrollable vomiting, diabetes, excessive sweating.
Decrease ↓Ht
- Anemia;
- Pregnancy;
- Hyperproteinemia;
- Overhydration;
- A state of increased circulating plasma volume.
Red blood cells
Reference values
| Men | 4.0-5.1 x 10¹²/l |
| Women | 3.7-4.7 x 10¹²/l |
Interpretation of the results obtained
Increase ↑ Er
- Reactive erythrocytosis caused by oxygen deficiency in tissues (cor pulmonale; heart defects; emphysema) or caused by excessive formation of erythropoietins (polycystic kidney disease, neoplasms, Cushing's disease and syndrome);
- Dehydration;
- Decrease;
- Acute blood loss;
- Overhydration;
- Anemia.
Mean erythrocyte volume ( MCV ) MCV = Total volume of erythrocytes in a certain volume of blood / Number of erythrocytes in the same volume. The MCV value is expressed in femtoliters (1 fl = 1 µm3).
Reference values
| Age, gender | MCV, fl |
| < 2 weeks | 88 — 140 |
| 2-4 weeks | 91 — 112 |
| 4-9 weeks | 84 — 106 |
| 9 weeks – 4 months | 76 — 97 |
| 4 months - 5 years | 68 — 85 |
| 5 -10 years | 75 — 87 |
| 10 - 12 years | 76 — 94 |
| 12 – 18 years old | 73 — 98 |
| 18-65 years old | 80 — 100 |
| >> 65 years old | 81 — 103 |
Interpretation of the results obtained
Normal MCV levels can accompany the early stages of iron deficiency, sideroblastic and megaloblastic anemia, anemia in kidney diseases, endocrine disorders, acute posthemorrhagic anemia, hereditary microspherocytosis, anemia in leukemia, aplastic anemia, protein deficiency, mixed malnutrition. MCV less than normal values is assessed as microcytosis and is observed in iron deficiency anemia, thalassemia, sideroblastic anemia, anemia due to chronic infections, malignant tumors, systemic diseases, hemoglobinopathies. MCV greater than normal values is assessed as macrocytosis. Characteristic of megaloblastic, aplastic, severe hemolytic anemia, MDS, leukemia, during treatment with cytostatic drugs. The MCV index must be interpreted in conjunction with other blood parameters. A false decrease in MCV is observed with hyperglycemia (more than 20 mmol/l).
Hemoglobin content in an erythrocyte ( MCH ) MCH characterizes the average hemoglobin content in an individual erythrocyte, in picograms (pg). Based on the MCH value, hypo-, hyper- and normochromic anemias are distinguished. Clinical assessment of this indicator is carried out in conjunction with others.
Reference values
| Age, gender | MSN, pg |
| < 2 weeks | 30-37 |
| 2-4 weeks | 29-36 |
| 4-9 weeks | 27-34 |
| 9 weeks - 4 months | 25-32 |
| 4 months - 3 years | 24-30 |
| 3-15 years | 25-31 |
| Over 15 years old | 26-34 |
Interpretation of the results obtained
MCH within normal limits is observed in aplastic anemia, leukemia, MDS, anemia in kidney diseases, endocrine disorders, protein deficiency. A decrease is typical for severe iron deficiency anemia, thalassemia, sideroblastic anemia, anemia in malignant tumors, chronic infections, systemic diseases, etc. A high level of MCH is observed in megaloblastic anemia, MDS, leukemia, severe hemolytic anemia, and treatment with cytostatics.
Mean erythrocyte hemoglobin concentration (MCHC) MCHC is the number of grams of hemoglobin in 100 ml of erythrocytes (the ratio of weight to volume of erythrocytes). MCHC = HGB/HCT MCHC is the most stable indicator, because the maximum load of erythrocytes with hemoglobin is 36 g/100 ml with a normal cell volume.
Reference values
28-36 g/dl
Interpretation of the results obtained
A decrease in MCHC indicates a violation of hemoglobin synthesis and accompanies iron deficiency, sideroblastic anemia, thalassemia, polyetiological microcytic-hypochromic anemia in chronic infections, oncological and systemic diseases.
Red blood cell anisotropy coefficient (RDW)
Interpretation of the results obtained
Reflects differences in red blood cell volume, i.e. degree of anisocytosis. This indicator provides a quantitative assessment of the dispersion of erythrocytes by volume, therefore RDV within the normal range (11.5-14.5%) indicates the presence in a given sample of only a population of erythrocytes homogeneous in volume (normo-, micro- or macrocytes). An RDW of more than 15.0% indicates the presence of cells heterogeneous in volume (micro-, normo-, macro- and schizocytes). In connection with the above, RDW should only be assessed in parallel with red blood cell histogram analysis and morphological examination of the blood smear. Red blood cell histogram is a graphical distribution of red blood cells by volume as a result of the analysis of several thousand particles with a volume from 40 fl to 240 fl. Red blood cell histograms clearly show the presence of microcytes, macrocytes or a mixed population of red blood cells, clearly demonstrating positive dynamics in the treatment of anemia. The pattern of the erythrocyte histogram may change if there are a large number of schizocytes, macrothrombocytes, erythrocyte or platelet agglutinates, and small lymphocytes in the blood being tested. A plateau to the right of the peak indicates the presence of significant amounts of red blood cell fragments, platelet macroforms, or platelet aggregates. An additional peak due to elements greater than 140 fL is most often associated with the presence of erythrocyte agglutinins. In chronic lymphocytic leukemia with a predominance of small lymphocytes, an additional peak appears in the erythrocyte histogram in the region of approximately 200 fL.
Reticulocytes The reticulocyte count reflects the rate of red blood cell production in the bone marrow. Their counting is important for assessing the degree of erythropoiesis activity. When erythropoiesis accelerates, the proportion of reticulocytes increases, and when it slows down, it decreases. In the case of increased destruction of red blood cells, the proportion of reticulocytes may exceed 50%. With sharply accelerated erythropoiesis, normoblasts (precursors of reticulocytes) may appear in the blood. Reticulocytes are found in greater numbers in newborns than in adults.
Reference values
| Age | Meaning, % |
| 0-2 days | 30-70 |
| 2-6 days | 10-30 |
| 6-8 days | 0-10 |
| 8 days - 5 weeks | 2-20 |
| 5 weeks - 7 weeks | 3-35 |
| 7 weeks - 10 weeks | 4-48 |
| 10 weeks - 12 weeks | 3-42 |
| 12 weeks - 15 weeks | 3-36 |
| 15 weeks - 12 months | 2-28 |
| 1-120 years old husband | 5,1-18,1 |
| 1-120 years old women | 5,0-17,0 |
It is advisable to use the “reticulocyte index” to assess the severity of anemia: % reticulocytes x hematocrit of the patient/45 x 1.85 where: 45 is a normal hematocrit, and 1.85 is the number of days required for the entry of new reticulocytes into the peripheral blood Index < 2 – evidence of a hypoproliferative component of anemia; index > 2-3 – evidence of increased red blood cell production
Interpretation of the results obtained
Increased ↑reticulocyte content
- Blood loss or destruction of red blood cells (3-6 times increase);
- Hemolytic anemia (up to 300%);
- Treatment of B12-deficiency anemia (reticulocyte crisis on days 5-8 of vitamin B12 therapy). The number of reticulocytes can increase up to 200%;
- Effective therapy of iron deficiency anemia with iron preparations (8-12 days of treatment);
- Thalassemia;
- Malaria;
- Other hematological diseases (polycythemia, cancer metastases to the bone marrow);
- Acute oxygen starvation.
Decreased ↓ reticulocyte content
- Aplastic anemia;
- Hypoplastic anemia;
- Untreated B12 deficiency anemia;
- Autoimmune diseases of the hematopoietic system;
- Alcoholism;
- Cancer metastases to bone;
- Myxedema;
- Kidney diseases.
A comprehensive interpretation of all red blood indicators provided by modern hematological analyzers provides rich information for diagnosing erythropoiesis disorders, monitoring therapy, and assessing the severity of pathology.
Leukocytes
Reference values
4.0-9.0 x 10⁹/l
Interpretation of the results obtained
Increased ↑ leukocyte count
- Infections;
- Inflammatory conditions Leukemia and other neoplasms;
- Injuries;
- Uremia.
Decrease ↓ leukocyte count
- Toxic lesions or effects of ionizing radiation;
- Metastases to the bone marrow;
- Hypersplenism;
- Myelodysplastic syndrome;
- Sepsis;
- Anaphylactic shock;
- Collagenoses.
Leukocyte formula
Reference values
- Band neutrophils 1-5%
- Segmented neutrophils 40-70%
- Eosinophils 1-5%
- Lymphocytes 20-45%
- Basophils 0-1%
- Monocytes 3-8%
Interpretation of the results obtained
Shift to the left: (in the blood metamyelocytes, myelocytes)
- Acute infectious diseases;
- Acidosis and comatose diseases;
- Physical stress;
- Shift to the left with rejuvenation: (in the blood there are metamyelocytes, myelocytes, promyelocytes, myeloblasts, erythroblasts):
- Chronic leukemia: erythroleukemia, myelofibrosis;
- Metastases of malignant neoplasms;
- Acute leukemia.
Shift to the right: (hypersigmented granulocytes in the blood)
- Megaloblastic anemia;
- Kidney and liver diseases;
- Condition after blood transfusion.
Neutrophils
Interpretation of the results obtained
Neutrophilia
- Infections: bacterial, fungal, spirochetal, some viral, rickettsial, parasitic;
- Inflammatory process: rheumatism, rheumatoid arthritis, tissue damage (after surgery), ischemic necrosis, gout, hypersensitivity to drugs, smoking, colitis, pancreatitis, nephritis, myositis, thyroiditis, dermatitis, periodontitis;
- Intoxications: diabetes mellitus, uremia, eclampsia, necrosis of liver cells,
- Blood diseases: chronic myeloid leukemia, polycythemia vera, myelofibrosis with myeloid myeloplasia, thrombocytopenia, condition after splenectomy, hemolytic anemia, bleeding, chronic idiopathic leukocytosis, malignant tumors;
- Mental and emotional agitation;
- Drugs: corticotropin, corticosteroids, adrenaline, lithium, endotoxins, histamine, heparin, acetylcholine, insect poisons, lead, mercury, ethylene glycol, digitalis, carbon dioxide, turpentine, chlorpropamide.
Neutropenia
- Infections: bacterial, viral, rickettsial, protozoal, debilitating infections of any type, especially in elderly and weakened people;
- Blood diseases: aplastic anemia, acute leukemia, idiopathic neutropenia, hypersplenism, megaloblastic anemia, anemia due to decreased bone marrow function, iron deficiency anemia;
- Anaphylactic shock;
- Hypothyroidism;
- Thyrotoxicosis;
- Cirrhosis of the liver;
- Periodic neutropenia;
- The influence of drugs: painkillers, tranquilizers, cyclic antidepressants, sulfonamides, antithyroid drugs, anticonvulsants, antihistamines, antimicrobials, hypoglycemics, etc.
Eosinophils
Interpretation of the results obtained
Eosinophilia
- Allergic diseases;
- Skin diseases;
- Parasitic infestations;
- Blood diseases;
- Malignant tumors;
- Pulmonary infiltration;
- Irradiation;
- Periarteritis nodosa;
- Some poisonings;
- Idiopathic eosinophilia;
- Congenital eosinophilia;
- Effect of drugs: aminosalicylic acid, chlorpropamide, imipramine, penicillin, sulfonamides, etc.
Eosinopenia
- Most pyogenic infections;
- Childbirth, eclampsia;
- “aggressive” surgical interventions;
- Shock;
- Effect of drugs: corticotropin, adrenaline, glucocorticoids, nicotinic acid, nicotinamide.
Basophils
Interpretation of the results obtained
Basophilia
- Chronic myeloid leukemia;
- Polycythemia vera;
- Chicken pox;
- Hypersensitivity reaction to food;
- Nephrosis;
- Chronic hemolytic anemia;
- Ulcerative colitis;
- Lymphogranulomatosis;
- Condition after splenectomy;
- influence of medications: estrogens, antithyroid drugs, desipramine.
Basopenia
- Hyperthyroidism;
- Ovulation;
- Pregnancy;
- Stress;
- Acute infections;
- Cushing's syndrome.
Lymphocytes
Interpretation of the results obtained
Lymphocytosis
- Infectious mononucleosis;
- Infectious lymphocytosis;
- Infectious hepatitis;
- Whooping cough;
- Brucellosis;
- Tuberculosis,
- Syphilis;
- Acute and chronic lymphocytic leukemia;
- Heavy chain diseases;
- Effect of drugs: aminosalicylic acid, haloperidol, narcotic analgesics, phenytonin, lead poisoning, tetrachloroethane.
Lymphopenia
- Acute infections;
- Milliary tuberculosis;
- Loss of lymph through the intestines;
- Lymphogranulomatosis;
- Aplastic anemia;
- Kidney failure;
- Cancer;
- Immunodeficiency conditions;
- Effect of drugs: corticotropin, glucocorticoids, lithium, nicotinic acid.
Monocytes
Interpretation of the results obtained
Monocytosis
- Subacute septic endocarditis;
- Infections;
- Granulomatosis;
- Ulcerative colitis;
- Acute monocytic leukemia;
- Myelomonocytic leukemia;
- Multiple myeloma;
- Aplastic anemia;
- Collagenoses;
- The influence of drugs.
Monocytopenia
- Bone marrow damage;
- After treatment with glucocorticosteroids;
- For infections with neutropenia.
Platelets Diagnostic value Identification of causes of bleeding caused by thrombocytopenia and/or thrombocytopathy.
Reference values
The number of platelets in the blood is 180-320×109/l.
Interpretation of the results obtained
Platelet pathology is the cause of bleeding in almost 80% of cases. Thrombocytopenia is its most common manifestation. Physiological fluctuations in the number of platelets in the blood during the day are approximately 10%. In women during menstruation, the platelet count can decrease by 25-50%. Platelets perform angiotrophic, adhesive-aggregation functions, participate in coagulation processes, and ensure blood clot retraction. They are able to carry circulating immune complexes on their membrane and maintain vasospasm. In 80-85% of patients with hemorrhagic diathesis, disturbances in the hemostatic system are caused by a decrease in the number or functional activity of platelets. In cases where the platelet count is less than 150 × 109/L, thrombocytopenia should be noted. The frequency of this phenomenon is quite high - from 10 to 130 new cases per 1 million population. There are acute and chronic thrombocytopenia. The latter is diagnosed when its duration exceeds 6 months. In individuals with platelet levels above 50×109/L, thrombocytopenia is extremely rarely accompanied by bleeding. However, a decrease in platelets below 100×109/L can accompany serious pathology. In this regard, the cause of each case of thrombocytopenia must be clarified.
Decreased ↓ platelet count (<180x109/l)
- A decrease in the number of platelets in the blood is observed with inhibition of megakaryocytopoiesis, impaired platelet production, with splenomegaly, increased destruction and/or utilization of platelets. The following conditions and diseases may be the cause of a decrease in platelet count.
Thrombocytopenia associated with decreased platelet formation (hematopoietic insufficiency) Acquired
- Idiopathic hypoplasia of hematopoiesis;
- Viral infections (viral hepatitis, adenoviruses);
- Intoxication (ionizing radiation, myelosuppressive chemicals and drugs, some antibiotics, uremia, liver disease);
- Tumor diseases (acute leukemia, metastases of cancer and sarcoma to the bone marrow, myelofibrosis and osteomyelosclerosis);
- Megaloblastic anemia (deficiency of vitamin B12 and folic acid);
- Nocturnal paroxysmal hemoglobinuria.
Hereditary
- Fanconi syndrome;
- Wiskott-Aldrich syndrome;
- May-Hegglin anomaly;
- Bernard-Soulier syndrome.
Thrombocytopenia caused by increased platelet destruction Autoimmune idiopathic
- Werlhof's disease
Secondary
- with systemic lupus erythematosus;
- viral infection;
- chronic lymphocytic leukemia, etc.;
- in newborns due to the penetration of maternal autoantibodies into the internal environment of the child’s body.
Isoimmune
- neonatal;
- post-transfusion.
Hapten drugs (hypersensitivity to certain drugs). Associated with mechanical damage to platelets:
- for heart valve replacement;
- extracorporeal circulation;
- with nocturnal paroxysmal hemoglobinuria (Marchiafava-Micheli disease).
Thrombocytopenia caused by platelet sequestration, sequestration in hemangioma, sequestration and destruction in the spleen:
- hypersplenism – Gaucher disease;
- Felty's syndrome;
- sarcoidosis;
- lymphoma;
- splenic tuberculosis;
- myeloproliferative diseases with splenomegaly, etc.
Thrombocytopenia associated with increased platelet consumption
- Disseminated intravascular coagulation syndrome;
- Thrombotic thrombocytopenic purpura, etc.
Increased ↑ platelet (>320*109/l)
- An increase in the number of platelets in the blood (thrombocytosis) may be primary, i.e. be the result of primary proliferation of megakaryocytes, and secondary, reactive, occurring against the background of any disease.
An increased number of platelets can cause the following diseases: Primary thrombocytosis
- essential thrombocythemia (the number of platelets can increase to (2000-4000)x109/l or more);
- erythremia;
- chronic megakaryocytic myeloid leukemia and myelofibrosis.
Secondary thrombocytosis:
- acute rheumatism;
- rheumatoid arthritis;
- tuberculosis;
- cirrhosis of the liver;
- ulcerative colitis;
- osteomyelitis;
- amyloidosis;
- carcinoma;
- lymphogranulomatosis;
- lymphoma;
- condition after splenectomy (for 2 months or more);
- acute hemolysis;
- 7-10 days after the onset of subacute toxic-infectious DIC syndrome;
- after acute bleeding;
- for malignant neoplasms (a precursor to a tumor of the lung, pancreas);
- chronic DIC syndrome.
Mean platelet volume (MPV)
Reference values
7.4 – 10.4 fl
Interpretation of the results obtained
In apparently healthy individuals, MPV is inversely related to the platelet count. MPV increases with age: from 8.6 - 8.9 fL in children 1-3 years old to 9.3-10.6 fL in people over 70 years of age.
Increase ↑ MPV
- Idiopathic thrombocytopenic purpura;
- Thyrotoxicosis;
- Diabetes;
- Atherosclerosis;
- Myeloproliferative diseases;
- Macrocytic thrombocytodystrophy of Bernard-Soulier;
- May-Hegglin anomaly;
- Posthemorrhagic anemia;
- Smokers and alcoholics.
Decrease ↓ MPV
- Condition after splenectomy;
- Wiskott-Aldrich syndrome.
Platelet distribution width (PDW) PDW – platelet distribution width – quantitatively reflects the heterogeneity of the population of these cells in size (degree of platelet anisocytosis). This indicator changes in myeloproliferative diseases.
Reference values
15,0 – 17,0%.
Graphic distribution of platelets by size (histogram) Modern hematological analyzers draw thrombocytometric curves (histograms of platelet distribution by volume). There is a connection between the size of platelets and their functional activity, the content of biologically active substances in platelet granules, the tendency of cells to adhere, and changes in platelet volume before aggregation. The presence of predominantly young forms of platelets in the blood leads to a shift of the histogram to the right, old cells are located in the histogram on the left. Consequently, as platelets age, their volume decreases.
Raising RDW
The RDW level can be elevated in some situations. The most common cause of this pathology is iron deficiency anemia. The indicator can change at different stages of pathology development, which is clearly reflected in the histogram of red blood cells:
- The initial stage of anemia development is characterized by normal indices, but hemoglobin will be greatly reduced. This is the result of healthy functioning of the spinal cord.
- The next stage of development in the histogram will show an increase in RDW. When there are problems with hemoglobin, indicators such as the average concentration and content of hemoglobin in a blood cell and the average volume of red cells decrease.
When treating IDA, it is necessary to normalize the level of concentration of iron-containing protein and its characteristics in the human blood.
Find out the volume
Only laboratory specialists can accurately determine the average volume of red blood cells. To do this, they conduct special studies, during which red cells are counted. You can calculate the exact amount by dividing the number of cell volumes by the number of red blood cells that is needed.
According to specific meanings, red blood cells are divided into:
- Macrocytes (the average erythrocyte volume increases and reaches one hundred or more values).
- Normocytes (the average erythrocyte volume varies from eighty to one hundred indicators).
- Microcytes (the average erythrocyte volume does not reach eighty).
Accurate analysis can be significantly difficult when there is a sufficiently large number of abnormal red blood cell forms in the patient's blood. Some doctors include sickle cells among these forms.
What do the reduced numbers mean?
Patients often ask what this means: “red blood cell distribution index is reduced.” Since the erythrocyte distribution index cannot be assessed without a volume indicator, it is necessary to familiarize yourself with all the options for underestimated indicators and their relationship:
- RDW is low and MCV is below average - indicating problems with the spleen and liver.
- RDW is lowered, and MCV is higher than the normal level - indicates the presence of oncological pathologies, mainly the development of metastases in the bone marrow.
The fact that the erythrocyte distribution index RDW sd is reduced, from a biological point of view, cannot, in principle, be observed. For this reason, most often the patient is offered to donate blood again, observing the following conditions:
- stop smoking and drinking alcohol for 24 hours before blood sampling;
- do not take any medications before the analysis;
- Avoid eating smoked and salty foods the day before.
In the case when the erythrocyte distribution index RDW sd is indeed reduced, which is necessarily confirmed by deviations from the norm in the MCV indicator, then this indicates the occurrence of certain pathologies. These include:
- Hypochromic microcytic anemia - sometimes also called anemia. A condition in which irregularly shaped red blood cells die because they have no biological value in the body.
- Malignant tumors - usually in this case we are talking about mastopathy, bone marrow and lung cancer.
- Hemolysis of red blood cells is a process during which red blood cells die without reaching their target. As a result, active hemoglobin is released.
Preparation for the procedure
Since taking blood for a general analysis does not imply anything unusual, and the study itself is carried out regularly for almost all people, preparation does not require a person to take any special measures, but no one has canceled the standard recommendations before taking tests so that the results are reliable and correctly reflect the clinical picture:
- The RDW test is taken in the morning and on an empty stomach. Dinner in the evening of the previous day before donating blood should be light and at least 8 hours should pass between the last meal and the test, and preferably 12
- It is highly not recommended to drink alcohol 2 days before the test, as it can significantly distort the results
- It is advisable to give up fatty and fried foods, which have a negative effect on the body, 2 days in advance.
- You should not take a blood test after physiological and x-ray procedures
- It is recommended to refrain from smoking one hour before blood collection.
- It is advisable to exclude any physical and emotional stress; before the analysis, a 15-minute break and complete calm are required.
- Particular attention must be paid to the medications you are taking. Almost any medicine can distort the results of a blood test, so before donating blood you need to consult with a specialist: you may have to stop taking the medicine for a while to get an accurate clinical picture, or simply take the drug after the test.
If a repeat blood test is prescribed, it must be taken at the same time (since the composition of the blood may depend on the body’s circadian rhythms) and in the same laboratory. This is due to the fact that units and methods of measurement may vary between laboratories. Only if all recommended measures are followed will the result of the study be correct.
Causes
So, the erythrocyte distribution index is reduced - what does this mean? There are several reasons that can reduce the RDW indicator:
- Acute blood loss due to injuries and pathological bleeding.
- Frequent operations.
- A metabolic disorder during which the food consumed is not completely digested.
- Hormonal imbalance, which most often occurs in women.
- Deficiency of B vitamins and iron in the body.
- Blood diseases characterized by rapid destructive processes.
RDW increased: association with diseases
Elevated RDW values may indicate, but do not diagnose or confirm, the following diseases: [p, p, p, p]
- Lack of iron in the body or vitamin deficiency
- Lack of B vitamins, including B12 and folic acid
- Anemia (various types, including sickle cell anemia)
- Inflammation
- Insomnia
- Cardiovascular diseases
- Blood loss due to hemorrhage (including surgery)
- Thalassemia
- Liver disease
- Kidney disease
- Cancer
- Alzheimer's disease
- Alcoholism
- and others.
However, RDW may still be at normal levels in people with leukemia, or with certain types of anemia (such as aplastic anemia). Therefore, it is important to look not only at the RDW value, but also at the relationship with other markers. [R]
What measures to take?
What to do when the red blood cell distribution index is low?
A highly qualified doctor during a consultation will most likely ask the patient to take the test again, because the RDW indicator is almost never underestimated. Because this suggests that all cells are ideal in their parameters, but this cannot happen in principle. If the indicator is confirmed by repeated analysis, then a full examination of the body’s condition is carried out, paying special attention to oncological examinations.
It's important to understand
Sometimes a person informed by a doctor about a decrease in the distribution of red blood cells by volume becomes very frightened. You should not immediately get upset and panic, since the test result does not always indicate the presence of a difficult-to-treat disease.
Having received the test result, a person should contact a highly qualified specialist. Only a good doctor will be able to correctly “decipher” the result, establish the cause and, if necessary, prescribe appropriate therapy.
Preventive measures
You can prevent a reduced RDW by following these simple rules:
- The diet should be balanced, which includes plenty of fresh fruits, lean meats and vegetables.
- It is recommended to breathe fresh air as often as possible.
- An active lifestyle will help prevent a decrease in the RDW index.
- It is very important not to skip routine medical examinations, during which most often serious deviations from the norm are detected that do not have external symptoms.
As a result, we learned that the red blood cell distribution index reflects their dimensions relative to each other and makes it possible to learn about their biological value. A decrease in RDW is very rare, but if the erythrocyte distribution index is decreased, this means that various pathologies may be present.
The index is calculated based on the results of a general blood test, but can only be fully valid in conjunction with the MCV indicator, since they are closely interrelated.
What do the results depend on?
RDW CV and SD values in the absence of health problems should correspond to established standards, which differ depending on the patient’s age and gender.
Any deviations up or down are a sign that pathological processes are occurring in the body or diseases are developing. But it also happens that the examination result turns out to be false positive. The causes of a laboratory error are a person’s failure to follow recommendations regarding proper preparation for blood sampling or incorrect actions of medical personnel.
If the result shows deviations from the norm, the analysis must be repeated to ensure the reliability of the results and eliminate errors.