© Author: A. Olesya Valerievna, candidate of medical sciences, practicing physician, teacher at a medical university, especially for SosudInfo.ru (about the authors)
The heart is one of the main “workers” of our body. Without stopping for a minute throughout life, it pumps a gigantic amount of blood, providing nutrition to all organs and tissues of the body. The most important characteristics of the efficiency of blood flow are the minute and stroke volume of the heart, the values of which are determined by many factors both from the heart itself and from the systems that regulate its functioning.
Minute blood volume (MBV) is a value characterizing the amount of blood that the myocardium sends into the circulatory system within a minute. It is measured in liters per minute and equals approximately 4-6 liters at rest with the body in a horizontal position. This means that the heart can pump all the blood contained in the vessels of the body in a minute.
Stroke volume of the heart
Stroke volume (SV) is the volume of blood that the heart pushes into the vessels during one contraction. At rest in the average person it is about 50-70 ml. This indicator is directly related to the condition of the heart muscle and its ability to contract with sufficient force. An increase in stroke volume occurs as the pulse increases (up to 90 ml or more). In athletes, this figure is much higher than in untrained individuals, even if the heart rate is approximately the same.
The volume of blood that the myocardium can throw into the great vessels is not constant. It is determined by the requests of authorities in specific conditions. So, during intense physical activity, anxiety, or in a state of sleep, organs consume different amounts of blood. The influences on myocardial contractility from the nervous and endocrine systems also differ.
As the heart rate increases, the force with which the myocardium pushes out blood increases and the volume of fluid entering the vessels increases due to the significant functional reserve of the organ. The reserve capacity of the heart is quite high: in untrained people, during exercise, cardiac output per minute reaches 400%, that is, the minute volume of blood ejected by the heart increases up to 4 times, in athletes this figure is even higher, their minute volume increases 5-7 times and reaches 40 liters per minute.
Physiological features of heart contractions
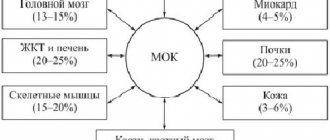
The volume of blood pumped by the heart per minute (MOC) is determined by several components:
- Stroke volume of the heart;
- Contraction frequency per minute;
- The volume of blood returned through the veins (venous return).
By the end of the period of myocardial relaxation (diastole), a certain volume of fluid accumulates in the cavities of the heart, but not all of it then enters the systemic circulation. Only part of it goes into the vessels and makes up the stroke volume, which in quantity does not exceed half of all the blood that entered the heart chamber during its relaxation.
The blood remaining in the cavity of the heart (about half or 2/3) is the reserve volume needed by the organ in cases where the need for blood increases (during physical activity, emotional stress), as well as a small amount of residual blood. Due to the reserve volume, as the pulse rate increases, the IOC also increases.
The blood present in the heart after systole (contraction) is called the end-diastolic volume, but it cannot be completely evacuated. After the release of the reserve volume of blood, a certain amount of fluid will still remain in the cavity of the heart, which will not be pushed out of there even with maximum work of the myocardium - the residual volume of the heart.
Cardiac cycle; stroke, end-systolic and end-diastolic volumes of the heart
Thus, when the heart contracts, it does not release all the blood into the systemic circulation. First, the shock volume is pushed out of it, the reserve volume is pushed out if necessary, and after that the residual volume remains. The ratio of these indicators indicates the intensity of the heart muscle, the strength of contractions and the efficiency of systole, as well as the ability of the heart to provide hemodynamics under specific conditions.
Blood pressure readings
Systolic blood pressure (SBP) converted to the auscultatory method:
SAD = SADf * K
where:
SADf – actual (invasive) systolic blood pressure is determined by the position of point “e” on the oscillogram.
K is an empirical coefficient.
Diastolic blood pressure (DBP) converted to auscultatory method:
DBP = DADf * K
Where:
DAPf – actual (invasive) diastolic blood pressure is determined by the position of point “b” on the oscillogram.
K is an empirical coefficient.
Mean hemodynamic blood pressure (MAP)
The integral value of all types of blood pressure reflects their average level during the full cardiac cycle. This is the driving force of blood flow. Determined by point “c” on the oscillogram.
Lateral systolic blood pressure (LSBP)
Blood pressure experienced by the inner surface of the vascular wall of an artery during systole. It corresponds to the moment when the maximum possible volume of blood penetrates into the compressed arterial vessel, expelled at the highest speed. Determined by point “d” on the oscillogram.
Pulse blood pressure (PBP)
ADP = SAD - DBP
Shock blood pressure (BP)
ADud = SADf - dietary supplement
IOC and sport
Physical activity is considered the main reason for changes in minute volume of blood circulation in a healthy body . This could be exercise in the gym, jogging, brisk walking, etc. Another condition for the physiological increase in minute volume can be considered excitement and emotions, especially in those who acutely perceive any life situation, reacting to this by increasing their heart rate.
When performing intense sports exercises, stroke volume increases, but not indefinitely. When the load has reached approximately half of the maximum possible, the stroke volume stabilizes and takes on a relatively constant value. This change in cardiac output is associated with the fact that when the pulse accelerates, diastole shortens, which means that the chambers of the heart will not be filled with the maximum possible amount of blood, so the stroke volume indicator will sooner or later stop increasing.
On the other hand, working muscles consume a large amount of blood, which does not return back to the heart during sports activities, thus reducing venous return and the degree of filling of the chambers of the heart with blood.
The main mechanism determining the normal stroke volume is the compliance of the ventricular myocardium. The more the ventricle stretches, the more blood will flow into it and the higher the force with which it will send it into the great vessels. With increasing load intensity, the level of stroke volume is influenced to a greater extent than compliance by the contractility of cardiomyocytes - the second mechanism regulating the value of stroke volume. Without good contractility, even a maximally filled ventricle will not be able to increase its stroke volume.
It should be noted that with myocardial pathology, the mechanisms regulating IOC acquire a slightly different meaning. For example, overstretching the walls of the heart in conditions of decompensated heart failure, myocardial dystrophy, myocarditis and other diseases will not cause an increase in stroke and minute volumes, since the myocardium does not have sufficient strength for this, and as a result, systolic function will decrease.
During the period of sports training, both stroke and minute volumes increase, but the influence of sympathetic innervation alone is not enough for this. A parallel increase in venous return helps to increase IOC due to active and deep breaths, the pumping action of contracting skeletal muscles, increasing the tone of the veins and blood flow through the arteries of the muscles.
The increased blood volume during physical work helps to provide nutrition to the myocardium, which is in great need of it, and to deliver blood to the working muscles, as well as the skin for proper thermoregulation.
As the load increases, blood delivery to the coronary arteries increases, so before you begin endurance training, you should warm up and warm up your muscles. In healthy people, neglect of this point may go unnoticed, but with pathology of the heart muscle, ischemic changes are possible, accompanied by pain in the heart and characteristic electrocardiographic signs (ST segment depression).
Determination of heart performance when performing a step test
Seluyanov V.N., Orel V.R.
The nature of the change in the heart rate-power relationship is varied. Several types can be distinguished (V.L. Karpman et al., 1974):
- - linear increase until the moment of failure to work (corresponds to the maximum oxygen consumption - MOC), Fig. 1, a;
— linear increase at the initial steps, then a turning point is noted on the graph and the rate of increase in heart rate becomes higher, the dependence also remains linear, Fig. 1, b;
— linear increase in heart rate to the level of 70–80% of MOC, and then the dependence smoothly slopes to the right, the increase in heart rate slows down and then stops, Fig. 1, c;
— a linear increase at the beginning, then a fracture is observed, the increase in heart rate increases, and before failure, a decrease in the increase in heart rate is again observed, Fig. 1, d.
Fig.1.
Types of “heart rate-power” dependencies when performing a step test.
It is obvious that deviations from a linear relationship are due to physiological laws. The most studied to date is the deviation from the linear relationship when the MPC power is reached. Conconi et al. (1982) suggested that in graphs "c" and "d" the deviation from the linear relationship to the right (HR deflation point - HRDP) is associated with the accumulation of lactate.
Conconi et al. suggested that with the accumulation of lactate, at the level of the anaerobic threshold, cardiac stroke volume (SV) begins to increase when performing a step test. Subsequently it was noted Jones AM., Doust JH. (1995) that HRDP is not found in children. Hofman et al., (1997) that HRDP occurs in 85% of cases in qualified athletes. Pierre-Marie Lepretre et al. (2005) suggested that in highly skilled athletes, SV increases until the point of failure to perform a graded test. As a result of the experiment, they were able to establish that in the group with the early onset of HRDP (50–70% of MIC), SV increases and stabilizes at a heart rate of 140–150 beats/min. In the group with the late onset of HRDP (70–90% of BMD), SV increases gradually and begins to increase sharply only at the end of the step test, but heart rate is no more than 175–185 beats/min. In general, the athletes had low stroke volume (145–155 ml) and minute circulatory volume (Qmax = 30–32 l/min).
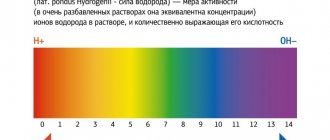
Thus, the experiment did not confirm the hypothesis and the reason for the change in stroke volume of the heart most likely lies not in a change in the concentration of lactate, but in hydrogen ions in the blood. Under the influence of hydrogen ions, excess carbon dioxide is formed, which leads to stimulation of the respiratory and heart control centers in the medulla oblongata. With an initial increase in lactate concentration, at the level of the aerobic threshold (about 2 mM/l), activation of the cardiovascular and respiratory systems begins. The heart rate increases and the stroke volume of the heart begins to stabilize. However, this influence should have a significant effect at low heart rates, in poorly trained athletes, and in skilled athletes this influence becomes incomparable with the activation that comes from muscle proprioceptors during high power work and the recruitment of almost all muscle fibers. Therefore, at large values of the stroke volume of the heart, when aerobic and anaerobic thresholds appear before a heart rate of less than 150 beats/min, two changes in heart rate acceleration can be recorded on the “heart rate - power” curve, which correspond to the appearance of aerobic and anaerobic thresholds. In other words, the initial acidification of the blood (aerobic threshold) and the beginning of the rapid accumulation of lactate and hydrogen ions in the blood (after 4 mm/l of lactate in the blood). It follows from this that the reaction of the heart depends on the joint influence on the control centers of the medulla oblongata, carbon dioxide (chemoreceptors of the aortic and sinocarotid zones of the aorta, (I. S. Breslav, 1980 [2]) and the afferent flow of impulses from active working muscles (G P. Conradi, 1980 [2]).
The presented hypothesis makes it possible to explain all the main types of changes in the heart rate-power relationship, and on its basis it is possible to propose a correct method for non-invasive assessment of cardiac stroke volume.
Rationale for the method of non-invasive assessment of cardiac stroke volume. The minute volume of blood circulation can be determined by Fick:
Q = VO2/(CO2 art − CO2 ven), where Q is the minute volume of blood circulation, VO2 ven is oxygen consumption per minute, CO2 art and CO2 ven are the oxygen content in arterial and venous blood, respectively. Since Q = SV×HR, we can write:
SV = VO2/ (CO2art − CO2ven)/HR = VO2/dCO2/HR. (1)
As the heart rate increases, the degree of oxygen absorption by the muscles increases, and reaches a maximum value when the maximum heart rate is reached. In practice, it can be assumed that the maximum minute volume of blood circulation is observed at a heart rate of 190 beats/min. This dependence can be represented as a hyperbolic function:
dCO2 = 50×((HR/HRmax) 0.2 − 0.69). (2)
Oxygen consumption is related to mechanical pedaling power on a bicycle ergometer by an almost linear relationship, since the coefficient of performance (efficiency) is 22–24%. In this case, 74–78 W accounts for one liter of oxygen consumption. Let's substitute these dependencies (2) into equation (1):
W/75 = SV×HR×50×((HR/190)0.2 − 0.69); (3)
SV = (W + Win)/HR×k×((HR/190)0.2 − 0.69). (4)
In the case of rest, when external power is zero, and metabolism at rest is related to body weight (MB), then internal power should be added to external power: Win = 0.3 × MB
SV = (W +0.3×MB)×100/(HR×3.75×((HR/190)0.2 − 0.69))
Methodology
To assess the accuracy of the developed method for determining the stroke volume of the heart, 97 athletes (men) of various sports specializations were examined. Age 18–34 years. Cardio-hemodynamics were measured at rest and while pedaling on a bicycle ergometer. Blood flow indicators, as well as heart rate, were determined using the REODIN software measuring complex (NTS Medas, Moscow), based on the method of impedance plethysmography (tetrapolar rheography of the central pulse). The values of heart rate, stroke volume SV, minute volume of blood MO were determined as a result of software processing of 10 cardiac cycles from the extracted differential rheogram. The required blood pressure values were measured using the Korotkoff method.
results
As a result of processing data on changes in heart rate and power. The values of the estimated stroke volume of the heart were obtained. These data were compared with experimentally determined values of cardiac stroke volume when pedaling on a bicycle ergometer with different power. As a result, the following values were obtained:
SV real = 133 ml, σ = 23 ml,
SV calculated = 131.5 ml, σ = 21.2 ml.
The correlation coefficient was 0.96 at p<0.001.
Discussion
An additional check for the correctness of the developed method for assessing stroke volume is to check the influence of the shape of the “heart rate - power” curve on the value of stroke volume. In Fig. 2, 3, 4 present these calculations. It can be seen that up to the level of ANP, the stroke volume of the heart is calculated correctly. And in the case of a curve of type “c” and “d”, an increase in stroke volume is observed until the MOC is reached. In the latter case, it can be assumed that mechanical power, after overcoming ANP, develops due to metabolic sources not related to oxygen consumption, due to the recruitment, for example, of glycolytic muscle fibers. In glycolytic muscle fibers there can be a different number of mitochondria, therefore, with a small number of them, the concentration of hydrogen and lactate ions intensively increases, therefore, heart rate accelerates, and with a large number of mitochondria, the concentration of hydrogen and lactate ions increases slowly, so there is no intense increase in heart rate. In this case, a “b” or “c” type curve shape is observed. In this regard, it can be stated that the developed method can adequately assess the stroke volume of the heart only at a power up to the level of ANP.
Conclusion
A method for non-invasive assessment of cardiac stroke volume has been developed, which allows obtaining adequate estimates before reaching the anaerobic threshold level.
Rice. 2.
Changes in stroke volume and heart rate when performing a step test by an athlete with a heart weight of 660 g, the shape of the curve is type “c”.
Rice. 3.
A typical graph of changes in stroke volume of the heart with the shape of the “heart rate-power” curve, type “c”.
Rice. 4.
A typical graph of changes in stroke volume of the heart with the shape of the “heart rate-power” curve, type “a”.
Literature
1. Karpman V. L., Belotserkovsky Z. B., Gudkova I. A. Study of physical performance in athletes. - M.: Physical culture and sport, 1974 - 130 p.
2. Physiology of blood circulation. Physiology of the heart. - L.: Nauka, 1980. - 598 p.
3. Conconi F., Ferrari M., Ziglio PG, Droghetti P., Codeca I.. Determination of the anaerobic threshold by a noninvasive field test in runners. J. Appl. Physiol., 1982. - 52. - P. 869–873.
4. Jones AM and Doust JH Lack of reliability in Conconi's heart rate deflation point. // Int. J. Sports Med. 16:541–544, 1995.
5. PM. Lepretre, C. Foster, JP. Koralsztein, V. L. Billat. Heart rate deflection point as a strategy to defend stroke volume during incremental exercise. // J. Appl. Physiol. 98:1660–1665, 2005.
Vascular parameters
Pulse wave velocity (PWV)
Characterizes the elastic-viscous state of the arterial vessel and its tone.
SPV = √(E*K*310)
Where:
E – elastic modulus;
K is a coefficient that takes into account the ratio of the thickness of the vessel wall to its radius.
310 is the multiplier.
Vascular Compliance (VCC)
Compliance of the vascular system, or systemic compliance, is the response capacity of the arterial bed of large arteries, coordinated with blood pressure.
PSS = UO/(BAA – DADf)
Where:
UO - see above;
Dietary supplement – see above;
DADf – see above;.
Total peripheral vascular resistance (TPVR)
The resistance provided to the ejection of blood from the arterial compression chamber is mainly associated with the patency of the precapillary bed. This indicator is defined as the ratio of the average hemodynamic pressure to the cardiac output.
OPSS= Avg*1333*60/SV
Where:
MAP—see above;
NE - see above;
1333 - see above;
60 is the number of seconds in a minute.
Actual specific peripheral resistance (UPSf)
This is the resistance related to the surface of the body, which is established under conditions of rest, i.e. at actual MAP and SV.
UPSf = SrADf/Sif
Where:
MAPf is the actual value of the average hemodynamic pressure at rest;
CIF - the actual value of the cardiac index at rest
Operating peripheral specific resistance (UPSR)
Resistance that should be present at actual SI, while maintaining the proper value of MAP. BPsr reflects the optimal state of resistance that would correspond to a given cardiac output while maintaining the proper values of BPsr.
UPS(r) = AvgAdd/Sif
Where:
MAPd is the proper value of the average hemodynamic pressure at rest;
SIF - see above
Ratio UPSF/UPSR
an indicator of the degree to which precapillary patency corresponds to cardiac output. Allows one to judge the characteristics of the response of precapillaries to changes in cardiac output.
Literature
- Hydrodynamics of blood circulation. Collection of translations edited by Regirer S.A. – M.: Mir, 1971. – 271 p., ill.
- Caro K., Pedley T., Schroter R., Sid U. Mechanics of blood circulation: Trans. from English - M.: Mir, 1981. - 624 p., ill.
- Hardware-software complex for non-invasive study of central hemodynamics using volumetric compression oscillometry “CAP CG osm-“Globus”. Instructions for use. Belgorod. LLC "Globus" 2004. – 51 p.
- Pedley T. Hydrodynamics of large blood vessels: Trans. from English – M.: Mir, 1983. – 400 pp., ill.
- Savitsky N.N. Some methods of research and functional assessment of the circulatory system. – L.: Medicine, 1956. – 329 p., ill.
- Fofanov P.N. Textbook on mechanocardiography. – L.: VMedA im. S.M.Kirova, 1977. – 111 p., ill.
- Eman A.A. Biophysical basis for measuring blood pressure. - L.: Medicine, 1983. – 128 p., ill.