Introduction
Myocardial infarction (MI) continues to be one of the leading health problems, despite the introduction of a number of new surgical and conservative treatment methods and tactics, including percutaneous coronary intervention (PCI) with the installation of a stent in the infarct-related artery.
The UK PCI Registry, based on an analysis of 88,188 ST-segment elevation MI from 2005 to 2013, reported a 5-year survival rate excluding extravascular death of 87.1% [1]. The long-term prognosis after myocardial reperfusion largely depends on the timeliness and quality of diagnosis of structural and functional changes in the heart, which contributes to adequate patient management. When stratifying risk for this population, the fundamental criterion is the ejection fraction (EF) of the left ventricle (LV) [2]. At the same time, EF values, although expressed quantitatively, are largely determined by the qualifications of the ultrasound specialist, which is reflected in the 10–14% inter-study variability of the indicator [3]. In addition, regional dysfunctions are recorded only when MI is more than 10% of the LV area and transmurality is more than 52%, determining the diagnostic accuracy of ultrasound indicators of LV systolic function relative to the results obtained using MRI at the level of 78%, and the predictive value of a negative result - at the level of 62% [4].
The inclusion of speckle tracking technology in the programs of modern ultrasound scanners has complemented the subjective visual assessment of global and local cardiac contractility with semi-automatic digital technology. Currently, according to the European Association of Cardiovascular Imaging (EACVI) committee, 96% of 96 echocardiography laboratories in 22 countries have a speckle tracking imaging program. However, the lack of standards for global and local deformation of the ventricular myocardium determines its limited use. In Europe, speckle tracking technology is used routinely in only 37% of laboratories, in some cases in 59%, and not used in 4% [5]. It is most often consulted when LV dysfunction is suspected with preserved EF.
When analyzing data from patients hospitalized with a diagnosis of acute MI in the medical unit of the Federal State Autonomous Educational Institution of Higher Education KFU in 2021, it was found that 41.5% had damage to the lower wall of the LV, which, compared with anterior MI, was more often accompanied by widespread coronary atherosclerosis (in 71 .4% and 44.4% of cases, respectively, p=0.01). Patients with this diagnosis, as a rule, were admitted to the hospital later (on the first day - 88.9% and 64.2%, respectively, p = 0.01), died at a younger age (median age - 68 years and 81 years, respectively ), hospital mortality among them was higher (6.2% and 2.8%, respectively, p=0.01).
Purpose of the study:
to evaluate the results of echocardiography using speckle tracking technology in working-age patients with acute inferior MI in the early period after coronary artery stenting.
Material and methods
The sample included echocardiography data from 55 people (44 men and 11 women of working age) with acute inferior MI from a contingent of people admitted to the medical unit of the Federal State Autonomous Educational Institution of Higher Education KFU from June 2021 to May 2021. The control group consisted of 29 practically healthy individuals appropriate age and gender. Exclusion criteria
The analysis included age over 65 years, atrial fibrillation, post-infarction cardiosclerosis, and unsatisfactory quality of ultrasound images.
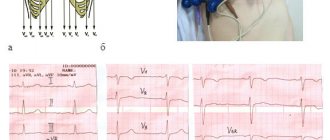
The study was performed on an Epiq-7 ultrasound scanner (Philips, USA) after 1 week. after PCI. Global LV systolic function was assessed by Simpson EF, excursion of the lateral end of the fibrous ring (mitral annular plane systolic excursion, MAPSE) in M-mode, velocities of systolic movement of the lateral (S'L) and septal (S's) ends of the fibrous ring of the mitral valve in pulse - wave mode of tissue Doppler, global longitudinal strain (GLS) and circular (global circumferential strain, GCS) deformations using speckle tracking technology. LVEF was taken as the norm for men >52%, for women - >54% [6], GLS - <-18% [7]. Regional LV function was analyzed visually in two-dimensional mode in 16 segments with calculation of the wall motion score index (WMSI) and quantitatively using speckle tracking technology according to longitudinal and circular deformations of 17 LV segments [6]. Impaired local contractility was diagnosed by visualizing dys-, a-, or hypokinesis of >2 adjacent segments.
Models of mortality and rehospitalization due to heart failure after acute myocardial infarction have clearly shown the greater prognostic significance of local contractility abnormalities compared with LVEF [8]. Based on this situation, patients with acute inferior MI, according to the results of a visual study in a two-dimensional mode of LV contractility, were divided into 2 groups: with the presence of zones of local contractility disturbances (dys-, a- and hypokinesis) - 45 people, without zones of local contractility disturbances - 10 Human. In both groups, men aged 50–65 years predominated (80%).
Statistical data processing
carried out using the AtteState program version 12.0.5 (Gaidyshev I.P., Russia) for Microsoft Excel. The normality of distribution of variation series was checked using the generally accepted Kolmogorov-Smirnov criteria. The median, upper and lower quartiles (Me (Q25; Q75)) of the analyzed samples were calculated. The statistical significance of differences was determined non-parametrically using the Mann-Whitney U test. The coincidence of the values of two independent samples was accepted as the null hypothesis. The critical level of significance when testing statistical hypotheses was p<0.05.
Research results
Angiography showed that the most common cause of MI was occlusion of the right coronary artery (in the group with zones of impaired local contractility - in 82.2%, in the group without zones of impaired local contractility - in 60%) against the background of multivessel lesions (in 84.4 % and 90% respectively).
The WMSI index, which takes into account not only the number, but also the degree of damage (dis-, a- and hypokinesis), was 1.13 (1.06; 1.19) with a norm of 1.0. In 13.3% of patients from the group with the presence of zones of impaired local contractility, akinesis was detected, in the rest - hypokinesis, characterized by a decrease in systolic thickening and movement of the affected segment. Among 45 individuals with local contractility disorders, a- and hypokinesis of the medial inferior (44.4%), basal inferior (68.9%) and inferolateral (49%) segments of the LV were more often visualized.
In a two-dimensional mode, according to the value of EF in the group with disturbances of local contractility, a slight decrease in global LV function was recorded in 28.9% of cases (in women - up to 44%, in men - up to 42%), while among people without zones of changes in local contractility of EF The LV remained within normal limits.
MAPSE values in M mode and S'L and S's in pulsed wave tissue Doppler mode reflect LV longitudinal systolic function. In the group with impaired local contractility, relative to the control group, the median MAPSE value decreased, but remained within the recommended norms (Table 1) [6].
Echocardiography using speckle tracking revealed a decrease in the global deformation of the LV myocardium in both the longitudinal and circular directions relative to both the control group and the recommended norms. It is fundamentally important that such changes were found in both groups of patients with acute inferior MI.
Among individuals with impaired local contractility, a decrease in GLS was recorded in 86.7% of cases, GCS in 76.7%, i.e., the frequency of detection of global LV systolic dysfunction compared to the traditional focus on EF increased 3 times. Moreover, in the group with preserved local contractility, changes in GLS were visualized in all subjects, and changes in GCS were visualized in 70% of subjects.
In the group with areas of impaired local contractility, a- or hypokinesis of the basal inferior septal segment of the LV was visualized in 11 patients; in the remaining 34 patients, the contractility of this segment was preserved. The S'S value is determined from the septal end of the fibrous ring of the mitral valve in the four-chamber apical position, which is the base of the basal inferior septal segment of the LV myocardium. Speckle tracking technologies determine not only global but also segmental deformation. To assess the role of the presence or absence of impaired contractility of the basal inferior septal segment of the LV, the values of parameters measured in this segment (S'S, longitudinal and circular strain) were divided into subgroups with a- and hypokinesis of the basal inferior septal segment and normokinesis of this segment. There were no statistically significant differences in the value of the systolic peak movement of the septal end of the annulus fibrosus (S's) and the regional longitudinal and circular deformation of the myocardium of the basal inferior septal segment between the subgroups (Table 2).
The SL and MAPSE values are recorded by the movement of the lateral end of the mitral valve annulus fibrosus in the four-chamber apical position, which is the base of the basal anterolateral segment of the LV myocardium. Hypokinesis of the basal anterolateral segment of the LV was absent among the examined patients. However, the median MAPSE among individuals with hypokinesis of the adjacent basal inferolateral segment (14 (13; 16) mm) was very significantly different (p = 0.0003) from the same indicator in the group without zones of impaired local contractility (16 (14; 17) ) mm).
Speckle tracking technologies determine not only global but also segmental deformation. For each of the 45 individuals in the group with the presence of zones of impaired local contractility, the local systolic function of 6 lower segments (basal inferior, basal inferoseptal, basal inferolateral, medial inferior, medial inferoseptal and medial inferolateral) was analyzed. Of these 270 segments, 17 segments were akinetic, 82 were hypokinetic, and the rest were normokinetic. Contrary to expectations, the degree of reduction in segmental longitudinal deformation did not depend on the presence and type (a-, hypokinesis) of systolic contraction impairment (Table 3). Moreover, worsening of the regional longitudinal strain of all 6 lower LV segments in patients with acute inferior MI was observed both in the group with impaired local contractility and in the group without impaired local contractility.
In all 3 analyzed groups (groups with zones of impaired local contractility and without zones of impaired local contractility, control group), the nonparametric correlation between the thickness of the basal inferolateral segment of the LV and the magnitude of segmental deformation of this segment turned out to be statistically insignificant. In two-dimensional mode, thickening of the basal inferolateral segment (≥11 mm) was detected in 59% of individuals with inferolateral hypokinesis: in 50% with inferior hypokinesis and in 63.6% with inferoseptal hypokinesis. It is possible that the thickening is caused by the development of myocardial edema. In 17.7% of patients with impaired local contractility and in 30% with preserved local contractility, a small amount of fluid was visualized behind the inferior and inferolateral wall of the LV in the form of diastolic separation of the pericardial sheets up to 1–2 mm. It is not customary to indicate such a small volume of fluid in the protocol, but its presence against the background of MI may indirectly indicate developing impairments in the contractility of these segments.
Electrocardiographic study.
ECG data that determine the degree of LVH include QT interval dispersion (QTD), which is considered to reflect heterogeneous ventricular repolarization.
An increase in QTD in some cases correlates with a complex of ventricular arrhythmias (VA). A study was conducted to evaluate QTD in arterial hypertension with LVH and to identify the relationship between an increase in QTD and the presence of QFA in this category of patients. Patients with LVH were divided into two groups according to diastolic septal thickness (1.2 cm or more and 1.1 cm or less). The average QTD value was 43.7 (range 10-128). This indicator was higher in patients of group 1 than in group 2 (56.1 and 51.5, respectively). Some patients in group 1 had QFA, and the QTD was longer. Thus, in patients with significant arterial hypertension, the presence of LVH is positively correlated with an increase in QTD. However, an increase in QTD does not indicate an additional risk factor for QOL [8]. The relationship between left ventricular size, as measured by ECG: R wave amplitude in lead V5 (RV5) and S wave amplitude in lead V1 (SV1), and blood pressure, as assessed by clinical measurements and automated monitoring, has been studied in patients with II and III GB stage. The sum of SV1+RV5 amplitudes correlates with clinical systolic, 24-hour, daytime and nighttime blood pressure levels, as well as with the difference in 24-hour, daytime systolic and nighttime blood pressure monitoring levels [2].
There are studies examining the relationship between left ventricular hypertrophy detected on ECG (ECG-LVH) and hemodynamically varying stenoses of the internal carotid artery (ICA) with isolated systolic hypertension (ISH), mixed hypertension (MH) and isolated diastolic hypertension (IDH). Partial correlation of ISH, IDH, amplitude of the R wave in lead I and the sum of the amplitudes of SV1+RV5, for each hypertensive subtype is shown by a tight positive correlation of diastolic blood pressure with the amplitude of the R wave in lead I and SV1+RV5 in all subtypes, excluding the amplitude of RI in patients with IDH [9].
To assess the state of the myocardium, the Sokolov-Lyon criterion is used [10].
In the early stages, LVH is accompanied by an increase in the amplitude of the QRS complex, which is associated with the level of hypertension, but when heart failure occurs, the amplitude of this complex decreases, simulating an improvement in the condition. As a result of this variability, this parameter is inconvenient for determining changes in the myocardium. As hypertension develops, more significant cardiac lesions appear, which are indicated on the ECG by ST segment depression [15, 11, 5, 3].
Thus, the most optimal parameters for identifying heart failure and its degree in hypertension are:
1. DBP;
2. EF, ESR, EDV (EchoCG data);
3. OPSS, MO (rheographic study data);
4. SV1+RV5, DQT (ECG data).
All of the above data individually are of only relative interest, since it is not possible to determine which of them should be used first. Therefore, at present, the practitioner relies on the totality of these indicators and, analyzing them, gets an idea of the contractile characteristics of the myocardium, which in the case of hypertension depends on left ventricular hypertrophy.
Discussion
Depending on the location of the lesion in the left ventricle of the heart, anterior and inferior MI are distinguished. Today, the attention of clinicians has shifted towards anterior MI, which is characterized by a more pronounced clinical picture and, as was believed for many decades, a worse prognosis. Data on the prevalence, hospital mortality and three-year mortality of lower MI in our institution coincide with the results of other researchers, indicating the equivalence of the occurrence of two forms of MI with high risks of long-term adverse consequences of lower MI [9, 10].
A number of studies have shown that after reperfusion therapy, LV contractile function is restored relatively quickly. Even with LVEF less than 40% in the acute period after 3 months. it does not recover in only 28% of patients [11]. Long-term persistence of low LVEF is regarded as a high risk factor for death. Observation of patients with inferior MI (n=1000) for more than 10 years revealed that among those who died there were worse values of EF (43±10%) and LV GLS (-12.0±3.5%) compared with those who survived ( 48±9% and -14.2±3.5%, respectively; p=0.001) [12].
Values less than 50% for lower MI are considered independent predictors of three-year mortality [10]. In our study, in the majority of patients, despite both the absence and presence of areas of local contractility impairment, LVEF remained within normal limits. A number of studies have also shown that lower MI is characterized by preserved or slightly reduced LVEF [13–15]. Normal LVEF values determined in B-mode after surgery can be misleading when choosing tactics and strategies for patient management. In these cases, to determine the risk of an unfavorable outcome, the most optimal option is the LV GLS value using speckle tracking. Thus, a value of more than -12.65% in the first 48 hours after reperfusion (n=110) indicated a high probability of adverse events after 30 days: cardiovascular death, readmission due to heart failure, or the need for urgent revascularization [2].
Earlier studies showed that after 1 week. after PCI in people with inferior MI, there is no improvement in GLS, GCS and radial deformities, or only longitudinal deformation is restored while basal rotation disturbances persist [16, 17]. Later, the use of single-photon emission computed tomography made it possible to establish that there is a significant connection between LV GLS and the size of the MI and one indicator can be derived from the other: with an MI area of more than 20%, the strain values will be less than -11.9%; with an area exceeding 40% - more than -10.7% [18]. Although, according to other sources (n=1128), disturbances in LV GLS are associated not with the size of the MI, but with the presence and severity of residual ischemia [19]. The lack of recovery of myocardial deformation in the early period after PCI can also be explained by the persistence of edema and stiffness of the LV myocardium. According to the results of cardiac MRI with contrast enhancement, on the 2nd day after PCI, 70.2% of patients with MI develop the phenomenon of microvascular damage in the form of obstruction and/or hemorrhagic permeation of the myocardium [20]. Such damage is explained by fragmentation and distal embolization of the thrombus at the time of recanalization.
In persons with acute MI of the inferior wall of the LV, upon visual examination in two-dimensional a-mode, hypokinesis is usually detected in only 2-3 of 16 LV segments. At the same time, studies using speckle tracking technology demonstrate that regional LV deformation worsens in 87% of segments and improves after PCI in 60% of segments [17]. The blood supply territory of the right coronary artery (according to our data, the infarct-related artery in 78.2% of cases of lower MI) does not exceed 6 segments, the circumflex artery (21.2%) - no more than 5 out of 17 segments. Consequently, the area of the LV with impaired segmental deformation is larger than the area of perfusion of the artery responsible for the occurrence of MI. It has been suggested that impairment of longitudinal strain outside the perfusion region of the infarct-related coronary artery may be a leading marker of adverse outcomes [21].
The detected decrease in the movement of the lateral end of the mitral valve annulus fibrosus in the four-chamber apical position with normokinesis of the basal anterolateral segment of the LV myocardium and hypokinesis of the basal inferolateral segment most likely indicates that MAPSE reflects a decrease in GLS to a greater extent than the topography of local dysfunction.
This can be confirmed by MRI results showing a decrease in the displacement of the atrioventricular ring in patients with MI after 1 week. after PCI did not depend on the area and location of the lesion [22].
The subjectivity of assessing local contractility in a two-dimensional mode determines the interest in the relationship of a- and hypokinesis with the values of deformation of the affected segments recorded using speckle tracking technology. It has been shown that in persons with MI, high sensitivity and specificity in diagnosing transmural segments using MRI is segmental longitudinal strain of more than -12%, akinetic segments using echocardiography - -13.3%, hypokinetic segments of the LV using echocardiography - -16.8% [ 23, 24]. With dyskinesia of the LV wall in the absence of coronary atherosclerosis, for example, with stress cardiomyopathy and pseudodyskinesis due to compression of the lower wall of the LV by the diaphragm, segmental deformation indicators remain normal [26, 27]. At the same time, in unstable angina, stenosis of more than 70% of the right coronary and circumflex arteries reduced the longitudinal segmental deformation of the basal inferior (from -19 to -12.5%) and basal lateral (from -21 to -14%) segments of the LV, respectively, in the absence of disturbances of local contractility [25]. According to our data, the presence and degree of local dysfunction do not affect the degree of reduction in segmental deformation (median ranged from -9 to -15%). In 6 lower segments, segmental deformation decreased with lower MI both in the presence of their a-, hypokinesis, and in their absence.
Left ventricular diastolic dysfunction
Ultrasound diagnostics doctor Paliy K.A.
Diastolic dysfunction to the inability of the left ventricle to fill and maintain stroke volume without a compensatory increase in atrial filling pressure.
To a large extent, it is determined by the ability of the myocardium to relax and the compliance (rigidity) of the wall. Impaired diastolic function of the left ventricle can be observed both in combination with a decrease in systolic function of the left ventricle, and in isolation (for example, in diseases accompanied by left ventricular hypertrophy). Increased myocardial fibrosis that develops with aging can also cause significant diastolic dysfunction.
Understanding approaches to assessing left ventricular diastolic filling requires knowledge of the four phases of diastole.
- Isovolumic relaxation phase. Diastole begins with the onset of relaxation of the left ventricle, which is marked by the closure of the aortic valve. During the initial period of relaxation, the pressure in the left ventricle decreases rapidly, but until it falls below the pressure in the left atrium, the mitral valve remains closed. Thus, during this phase of diastole, the aortic and mitral valves remain closed, so the volume of the left ventricular cavity does not change.
- Rapid early filling phase. The next period of diastole begins after the pressure in the left ventricle falls below the pressure in the left atrium, allowing the mitral valve to open. In this case, blood begins to flow passively (i.e., according to the pressure gradient) from the left atrium into the left ventricle. Typically, during this phase of diastole, the main filling of the left ventricle occurs (if we mean by this the volume of incoming blood and the speed of the transmitral flow).
- Slow filling phase (diastasis). During this phase, the pressure gradient between the left atrium and the left ventricle is minimal, so slow passive filling of the left ventricle occurs until it finally disappears.
- Late filling phase. During this final phase of diastole, the left atrium contracts, causing additional blood volume to be actively “pushed” into the left ventricle through the opening of the mitral valve. Normally, during this period, 20–30% of the total diastolic filling volume enters the left ventricle.
The above-described phases of diastole can be easily traced using pulsed wave Dopplerography, which visualizes changes in the speed of transmitral blood flow.
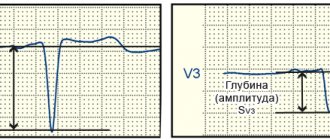
A typical transmitral flow velocity curve has two peaks: the first (peak E) corresponds to the rapid early ventricular filling phase, while the second relatively low-velocity peak (A) has a lower amplitude and coincides in time with atrial contraction. To assess left ventricular diastolic function, it has been proposed to use a large number of characteristics of the E and A peaks, but in practice only a few of them are routinely used: the maximum velocity of the E peak, the maximum velocity of the A peak, the ratio of the maximum E/A velocities and the deceleration time of the E peak.
As the diastolic function of the left ventricle is impaired, the end-diastolic pressure in its cavity begins to increase, which, in turn, causes an increase in pressure in the left atrium. As a result, the nature of the blood flow between the left atrium and the left ventricle changes, which can be recorded using pulsed wave Dopplerography of the incoming transmitral flow.
There are 4 main types of diastolic filling of the left ventricle:
- Normal. The volume and rate of early filling prevails over those during atrial systole (E>A).
- Impaired relaxation (Type 1 disorder of diastolic dysfunction). Impaired relaxation of the left ventricle leads to difficulty in the outflow of blood from the left atrium. Therefore, the volume and rate of early passive filling are reduced, and the maximum velocity of the E peak is reduced. In this case, left ventricular filling naturally becomes more and more dependent on atrial contraction at the end of diastole, and peak A (E<A) begins to dominate on the transmitral molasses velocity curve.
Violation of the diastolic function of the ventricle according to the first type can be a variant of the norm in older people, and occurs in people with arterial hypertension, angina pectoris, myocardial infarction, and myocarditis.
- Pseudonormal filling type (Second type). More severe left ventricular dysfunction results in an even greater increase in left atrial pressure, which is accompanied by an increase in the rate of early diastolic filling of the left ventricle. Therefore, the Doppler curve is again dominated by peak E (E>A), as with normal filling.
- Restrictive type of filling (Third type). In particularly severe cases, the pressure in the left atrium may be so high that filling of the left ventricle occurs almost completely in the early phase, and during other phases of diastole there is virtually no filling. Due to the fact that in such a situation the pressure in the left ventricle increases much faster as it fills, transmitral blood flow quickly stops. The maximum speed of peak E is much higher than the maximum speed of peak A (E>>A). This type of transmitral flow may be seen with restrictive cardiomyopathy (in which left ventricular systolic function is relatively high) or concomitantly with severe left ventricular systolic dysfunction due to other causes.
Factors influencing changes in transmitral blood flow can be divided into physiological and pathological. In turn, pathological ones are divided into extracardiac and cardiac.
Physiological causes include age, heart rate, patient position, breathing, preload (for example, changes in transmitral blood flow profile during exercise tests).
Extracardiac factors affecting transmitral blood flow: obesity, diabetes, renal failure, sleep apnea syndrome.
Cardiac causes: arterial hypertension (AH), coronary heart disease (CHD), cardiomyopathies, chronic heart failure (CHF), heart defects, myocarditis, pericardial diseases, etc.
Thus, echocardiography is the only available noninvasive method for assessing left ventricular diastolic function, which has important clinical implications.
Diastolic dysfunction is considered to be the onset of ventricular dysfunction in various heart diseases.
The degree of diastolic dysfunction may indicate the severity of the disease in patients with the same degree of systolic dysfunction.
The severity of diastolic dysfunction can act as an objective marker of the effectiveness of treatment or the course of the disease.
Riding E. Echocardiography. Practical Guide / Elisdair Riding; lane from English – 4th ed. – M.: MEDpress-inform, 2021. – 280 p.
Rybakova M.K. Practical guide to ultrasound diagnostics. Echocardiography / M.K. Rybakova and others - M.: Vidar-M Publishing House. 2008. – 512 p.