The incidence of cardiovascular pathology is growing rapidly, becoming epidemic. Mortality rates from these problems are also increasing, which makes the issue of treatment and especially prevention the most important in modern society. Coronary heart disease, as one of the manifestations of vascular atherosclerosis, has several forms. One of them is called subendocardial ischemia. What is the meaning of this intricate term and what to do if a doctor makes such a diagnosis?
Definition
Subendocardial ischemia is a disease associated with impaired blood supply to the heart muscle (myocardium). The term “subendocardial ischemia” is found in case reports and the cardiology literature. This condition is not permanent, i.e. for a short time. As a result, the ECG shows changes in the processes of ventricular repolarization. In this case, the myocardium acquires a negative charge without depolarization disturbances. Unlike the subepicardial type, with subendocardial ischemia the ischemic process itself occurs in a limited area of the heart muscle.
The concept of “myocardial ischemia” and its types
Ischemia means a discrepancy between the oxygen demand of organs or tissues and its supply, as a result of which hypoxia develops. Arterial vessels supply oxygen to the tissues along with blood. If their patency is impaired, blood flow and, accordingly, the amount of oxygen decreases. If an organ performs constant mechanical work, like the myocardium of the heart, it needs rapid elimination of ischemia, otherwise irreversible changes (necrosis) may occur in it.
Ischemia is aggravated by increased physical activity, as this increases the myocardial oxygen demand
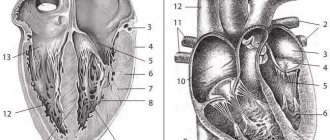
The structure of the heart wall consists of three layers:
- epicardium (external);
- myocardium (medium);
- endocardium (internal).
Based on this, ischemia can be localized under the outer ball of the wall (subepicardial) of the myocardium, under the inner ball (subendocardial) or pass through the entire wall (transmural). Subendocardial zones have a much greater sensitivity to ischemia than others due to the fact that the coronary arteries approach the heart muscle from the epicardium. The smallest caliber arteries are located under the endocardium. Therefore, the subepicardial layers are supplied with blood more powerfully, but the ischemia of these zones is always more significant. In addition, the outer and inner layers of the myocardium are always subject to greater compression during heart contractions than the middle ones.
Reference! Ischemia is a temporary process, and if the action of the damaging factor stops, blood flow resumes, and if not, irreversible changes develop in the heart muscle.
Subendocardial ischemia is transient in nature and limited to a small area of the myocardium. It causes the appearance of a negative charge on cardiomyocytes. The process of formation and propagation of an electrical impulse in the heart occurs thanks to the conduction system of the heart. During the passage of this impulse through the myocardium, complex bioelectric processes occur in the cells:
- depolarization,
- repolarization.
Subendocardial ischemia affects repolarization processes without changes in depolarization. Subepicardial ischemia extends to both the endocardium and the epicardium, covering a larger area of the myocardium.
Causes
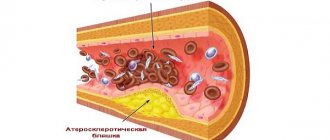
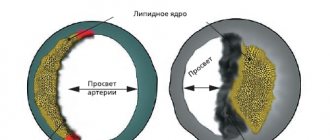
Under the influence of hypothermia, severe pain, and hormonal disorders, subendocardial ischemia can also be observed in healthy people. However, more often the cause of the disorder is coronary heart disease. It develops against the background of a lack of oxygen reaching the heart. Oxygen starvation occurs as a result of a malfunction of blood vessels. The most common cause of improper functioning of blood vessels is atherosclerosis. Cholesterol accumulates on the walls of blood vessels, as a result of which their walls become denser, and the lumen of the arteries narrows significantly or becomes completely clogged. Particularly dangerous is vascular occlusion in the area of branching arteries that supply oxygen to all vital organs.
Symptoms
Subendocardial ischemia manifests itself in an acute form or remains undetected for a long time, proceeding asymptomatically. Painless myocardial ischemia occurs. It is difficult to identify signs of the disease on your own, because painful sensations appear not only in the area of the heart muscle, but also in the left forearm, arm, intercostal area or scapula. Aching pain and a numb chin are less typical symptoms of this disease. One of the main manifestations of subendocardial ischemia is angina pectoris. It is characterized by aching pain in the chest area after physical activity, after going out into the cold, or after eating a large meal. Emotional outbursts and stress are the causes of exacerbation of this disease. In a calm state, it may not bother the patient or introduce discomfort into his daily rhythm of life.
Clinical case
A 74-year-old obese woman was admitted to our department with repeated episodes of chest pain over the past few days.
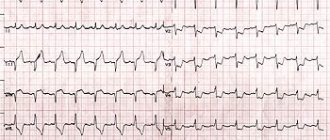
The photo below shows the ECG result recorded after the exercise. While recording the tape, the patient began to complain of chest discomfort. After the administration of Nitroglycerin, the patient felt better, and an ECG was re-recorded.
Coronary angiography performed on the patient showed severe stenosis of the right coronary artery.
Manifestations on the cardiogram
Subepicardial ischemia on the ECG will be visible as negative, symmetrical and peak T-waves in leads that correspond to the location of the affected area of the myocardium. T-waves can be dynamic, appearing only during pain, and also regress on their own or after the administration of Nitroglycerin.
Diagnostics
The electrocardiography method helps to detect subendocardial ischemia. This study shows changes in the T wave. However, an ECG alone is not enough to make a diagnosis. Additionally, the patient is prescribed Holter monitoring, when a portable device is used to record the patient’s heartbeats throughout the day. If necessary, stress tests, coronary angiography, and CT scanning are performed during the examination. Based on these and other methods, the cardiologist will draw up a complete picture of the disease and prescribe treatment.
T wave changes in ischemic heart disease
With ischemic heart disease, the T wave can be changed in two situations.
- With ischemia associated with an attack of angina, a negative T wave may be recorded in two (or more than two) adjacent leads.
- In the acute phase of myocardial infarction with ST elevation, a high positive T may be recorded.
Look at ECG 5 with an example of ischemia and inverted T waves.
ECG 5. Negative T waves in myocardial ischemia
ECG source.
ECG 5 shows inverted T waves in the left leads: V5-V6, I, aVL.
Negative T values indicate ischemia if the following conditions are met.
- The depth of negative T must be at least 1 mm.
- Negative T waves must be recorded in at least two adjacent leads.
- The QRS complex before the negative T has a tall positive R wave.
- Dynamics of change. These should be “new” inverted Ts (they should not be on old cardiograms). Within some time (hours or days) there should be a return of the T wave to the isoline.
In addition, it should be remembered that inverted T wave in leads III, aVR, V1 is a normal variant.
ECG 6 shows another example of a change in the T wave in coronary artery disease: high coronary T wave in the acute phase of myocardial infarction with ST elevation. This is the initial and very short period of a heart attack, so it is not always possible to register it on an ECG.
ECG 6. High positive T wave in the acute phase of myocardial infarction
ECG source.
Treatment
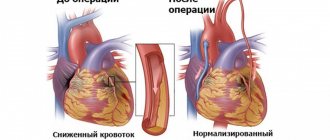
Treatment and prevention of the development of this disease according to the standards of treatment of coronary artery disease is carried out using pharmaceuticals. The patient is prescribed medications that thin the blood, dilate blood vessels and reduce the level of bad cholesterol. Sometimes medications and pills do not help well - in such cases, myocardial revascularization is indicated, i.e. surgery. If indicated, the attending physician will recommend a vascular stenting procedure, which involves the quick and painless implantation of a stent into an artery.
ST segment changes
Normally, the ST segment is located on or near the isoline.
Estimates of ST tolerances vary slightly across studies. There may also be different approaches to measuring ST deviation.
The following ST segment displacements are considered pathological.
- Decrease (depression) in ST by 0.5 mm or more in V2-V3 and by 1 mm or more in other leads.
- Increase (elevation) of ST by 2 mm or more in V2-V3 and by 1 mm or more in other leads in men (in men under 40 years old, an increase in ST in V2-V3 to 2.5 mm is acceptable).
- by 1.5 mm or more in V2-V3 and by 1 mm or more in other leads in women
If in two or more than two adjacent leads the ST segment deviates from the isoline by more than the specified values, then this is a pathology.
ST deviation is usually measured at the J point (where the QRS complex enters the ST segment), as well as at ST60 (0.06 s from the J point) and ST80 (0.08 s from the J point).
When measuring the ST deviation at the J point, comparison is made with the level of the PR interval at the point of transition of the PR to the QRS complex. This is shown in diagram 1.
Diagram 1. J point and PR transition point
Schema source.
ECG 1 shows how ST segment displacement can be measured. In the example shown, an ST depression of 2 mm was recorded.
ECG 1. Fragment of a cardiogram with ST segment shift
Measuring the ST segment displacement not at point J, but at a distance of 0.08 s, i.e. 2 mm from the J point may be an alternative approach. This is especially true when there is an initial shift in the PR interval and ST segment due to the atrial repolarization wave.
The wave of atrial repolarization (indicated by Ta) is superimposed on the QRS complex and, as a rule, is not visible on the ECG. However, in some cases, the Ta wave becomes noticeable and displaces the PR interval, QRS and initial ST region.
Illustration of the phenomenon of atrial repolarization, which shifts the PR interval, QRS and initial ST segment in diagram 2. Here the Ta wave is shown in red dotted line.
Scheme 2. Atrial repolarization wave Ta
Schema source.
It is believed that the duration of the atrial repolarization wave does not exceed 0.08 s after the end of the QRS complex. In this regard, the ST displacement measurement is in some cases carried out at a distance of 0.08 s from the J point. The point at a distance of 0.08 s (2 mm) from the J point is called the I point or ST80. When displacement is assessed at ST80, comparison is made with the TP interval (between the T wave and the P wave) rather than with the PR interval.
ECG 2 shows an example when the atrial repolarization wave simulates ST segment depression. A cardiogram was taken from a 25-year-old patient with complaints of chest discomfort. The patient abuses caffeine. The recording showed tachycardia and ST depression in leads II, III, aVF and V2-V6. However, if you look closely, you can also see that the PR segment has an oblique, downward shape. This is due to the atrial repolarization Ta wave, which also shifts ST downward. If you measure the ST level at point ST80 (2 mm after the J point) and compare it with the level of the TP segment, then there will be no significant depression.
ECG 2. ST shift caused by a pronounced wave of atrial repolarization
ECG source.
However, in the case of ECG 2, even without this adjustment, there was no evidence of ischemia, because the shape of the ST segment is obliquely ascending. Ischemia is characterized by downward or horizontal ST depression. Morphological assessment of ST segment changes is more important than assessment of displacement using one or another technique.
A displacement of the ST segment above or below its normal position can occur in different types of coronary artery disease, as well as in other heart pathologies (for example, with blockade of the ventricular pathways, with ventricular hypertrophy, with tachycardia and in other cases).
Different authors and different guidelines suggest different ways to measure ST levels, but everyone agrees that assessing the morphological pattern allows a more accurate conclusion to be made. Therefore, in order to understand what causes ST deviation in each specific case, you need to know the morphological variants of ST displacement.