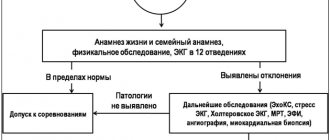
Electrocardiography (ECG) is one of the simplest, fastest and safest diagnostic procedures used to assess the condition of a baby’s heart, be it a newborn or an older child. An ECG measures and records changes in the electrical activity of the heart that characterize its performance. ECG data shows doctors the speed and regularity of the heart's contractions, the size and position of the heart's chambers, the amount of blood flowing into the heart muscle, and whether there are any abnormalities in its normal functioning. With the help of electrocardiography, it is possible not only to identify acute or chronic diseases that have already developed, but also to predict their occurrence, which means to begin treatment on time and prevent them.
Physical foundations of electrocardiographic research.
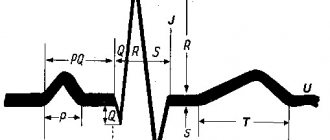
An electrocardiograph is a galvanometer device for recording the difference in electrical potentials between two areas of the heart’s projection onto the surface of the child’s body. During operation, the electrical activity of the heart constantly and rhythmically changes. For each stage of contraction or relaxation of the heart muscle of each section, there is its own unique “electrical” pattern, which is recorded by an electrocardiograph and issued in the form of a characteristic graph - a cardiogram on a strip of paper or a computer screen. The shape and parameters of the characteristic elements of the cardiogram (main intervals, amplitudes, shapes and sizes of teeth) carry information for the doctor about the normal or pathological physiology of the heart. The number of waves per minute on the graph shows the heart rate, the distances between identical elements of the cardiogram - heart rate. ECG waveforms show how the heart's electrical impulses are formed and how well the individual parts of the heart work together. Characteristic changes in the shape of the size and position of the waves on the cardiogram carry information about any damage to the heart.
Electrical activity from the surface of the body is recorded through small metal plates (electrodes) that are placed in specific places on the child's chest, arms and legs. The electrodes are connected to the cardiograph by wires through which information is recorded. The electrocardiograph records the electrical activity of the heart, all parameters that are measured, analyzed and printed for the doctor.
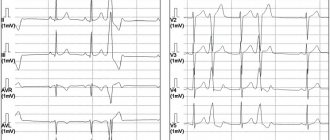
What does an ECG look like normally and with pathology?
Electrocardiogram parameters in adult men and women are presented in the table and look like this:
| ECG parameters | Norm | Deviation | Probable cause of deviation |
| RRR distance | Even spacing between teeth | Uneven distance |
|
| Heart rate | 60-90 beats/min at rest | Below 60 or above 90 beats/min at rest |
|
| Atrial contraction - R wave | Directed upward, outwardly resembles an arc. The height is about 2 mm. May not be present in ΙΙΙ, AVL, V1. |
|
|
| PQ interval | A straight line between the PQ teeth with an interval of 0.1-0.2 seconds. |
|
|
| QRS complex | Length 0.1 second - 5 mm, then T wave and straight line. |
|
|
| Q wave | Absent or directed downward with a depth equal to 1/4 of the R wave | Depth and/or width exceeding normal |
|
| R wave | Height 10-15 mm, pointing upward. Present in all leads. |
|
|
| S wave | Depth 2-5 mm, sharp end pointing down. |
| Left ventricular hypertrophy. |
| ST segment | Coincides with the distance between the ST teeth. | Any deviation of the horizontal line greater than 2 mm. |
|
| T wave | The height of the arc is up to 1/2 of the R wave or coincides (in the V1 segment). Direction - up. |
|
|
What kind of cardiogram should a healthy person have?
Indications of a good cardiogram for an adult:
- How to calculate heart rate from an ECG
| Prong | Lead | Description |
| R |
| Positive. |
| R | AVR | Negative. |
| T | AVR | Negative. |
| R | V1-V4 | Increase in amplitude. |
| R | V5-V6 | Reducing the swing of oscillations. |
| S | V1-V6 | Reduction until complete disappearance. |
| RST segment | On the isoline. | Error no more than 0.5 mm |
The video compares the cardiogram of a healthy and sick person and provides the correct interpretation of the data obtained. Taken from the channel “Life of a Hypertensive”.
Indicators in adults
An example of a normal ECG in adults:
| ECG indicators | Norm |
| QRS | 0.06-0.1 sec |
| P | 0.07-0.11 sec |
| Q | 0.03 sec |
| T | 0.12-0.28 sec |
| PQ | 0.12-0.20 sec |
| Heart rate | 60-80 beats/min |
Indicators in children
Electrocardiogram parameters in children:
| ECG indicators | Norm |
| QRS | 0.06-0.1 sec |
| P | No more than 0.1 sec |
| Q | 0.2 sec |
| QT | No more than 0.4 sec |
| Heart rate |
|
What diseases can be detected using electrocardiography in children?
Screening (preventive) electrocardiography of the heart, carried out in infants aged 4-5 days and 3-4 weeks of life, allows timely identification of electrocardiographic signs (arrhythmias, prolongation of the ventricular contraction phase), indicating the possible development of sudden death syndrome (one of the leading causes of infant mortality in the first year of life), and start preventive treatment on time.
- An ECG can detect hypertrophy of the baby's heart, which can be caused by congenital heart defects, abnormal heart valves, high blood pressure, insufficient cardiac contractility, or conduction problems.
- Electrocardiography can detect abnormalities in the electrical conductivity of the heart tissue, which can cause a child's heart to beat too fast, too slow, or at an uneven speed (arrhythmias), causing discrepancies in the rhythm of the atria and ventricles.
- An electrocardiogram will show how well the heart muscle is supplied with blood, and whether there are any disturbances in the blood supply to individual areas, both at rest and during physical activity.
- An ECG can be used to judge the functioning of the heart valves and disturbances in blood flow due to their dysfunction.
- Based on the ECG results, we can conclude that there is an imbalance in the level of electrolyte substances in the child’s blood that are necessary for the proper functioning of the heart muscle, such as potassium, magnesium and calcium.
- Electrocardiography can reveal signs of inflammatory heart diseases (endocarditis, myocarditis, pericarditis).
- Based on the results of the ECG, one can judge the presence of cardiomyopathy - an abnormality in the heart muscle itself.
Preparing a child for an ECG
Preparing your child for an electrocardiogram does not require restrictions on food and drink: your child can eat and drink as usual. It is recommended to feed the baby a few minutes before the test to calm him down. For an older child, you can take his favorite toy with you for research.
Your baby's skin should be clean: You should not apply any cream, lotion, powder or baby oil to your baby's skin on the day of the test.
The child's clothing should allow electrodes to be attached to the child's chest, wrists and ankles. Infants will need to be swaddled as directed by the nurse to ensure they remain still during the examination.
When is it prescribed and how is it done?
An ECG may be prescribed after a visit to the medical center by a cardiologist or pediatrician if the following alarming symptoms are present, voiced by parents or discovered by a doctor at the appointment:
- heart murmurs;
- attacks of headache, dizziness and fainting;
- lethargy and fatigue;
- chest pain;
- swelling of the hands and feet;
- high pressure;
- retardation in physical development;
- problems in the functioning of the endocrine system.
If a child complains of chest pain, it is worth making an appointment with a cardiologist at the Rostov-on-Don medical center for examinations and to determine the causes.
In the absence of any complaints or indications, an ECG is performed on children during a routine round of doctors for admission to kindergarten or school. The procedure is also carried out as part of a medical examination in sports sections.
Before giving your child an echo ECG or a regular cardiogram, you need to make sure that he is in a calm state. Infants can be examined immediately after eating or during sleep to minimize disturbance to them. Older children should be prepared in advance, explained what the procedure is, helped to relax and get rid of the fear of the doctor and the device. It is also worth choosing clothes that are as comfortable and quick to take off and put back on.
Before the procedure, it is important to provide the child with peace, avoid active games and emotional stress. It is advisable to feed no later than 1.5 hours before the test.
To conduct an ECG on an infant, a special belt with attached sensors can be used. For older children, special electrodes are attached to the body. After this, it is important for parents to ensure that the child remains still. Depending on the age, this can be done using diapers, or distracting the child with a toy or talking.
How is an ECG performed?
The total time of the electrocardiographic examination takes from 5 to 10 minutes, including attaching and detaching electrodes. During the examination, your child will lie on a special changing table or couch. Several electrodes (small plastic patches with metal strips) will be attached to your baby's chest, and one electrode will be attached to each arm and leg. The electrodes will be connected to the electrocardiograph by wires. During the ECG recording, the child will not feel anything unpleasant. Electrodes are just highly sensitive sensors that respond to changes in the electrical impulses of the heart. Under no circumstances will any current pass or pass through the child’s body.
It is important that your child lies still during the examination and does not speak during the procedure; for infants, it is important that the baby is calm and does not cry. You, as a parent, can be present to support and reassure your child during the procedure.
Once the recording of the study from the sensors is complete, the doctor or nurse will disconnect the wires and remove the electrodes from the skin. After the procedure, the child can lead his normal lifestyle without any restrictions. The research results will be analyzed by the electrocardiograph computer, and then by the doctor who performed the diagnosis, your pediatrician or pediatric cardiologist.
Due to its characteristics (in the 1st year of a child’s life, there are 12 different periods of age norms for ECG), the electrocardiogram of infants must be analyzed by the doctor who conducted the study.
Archives
Short Wiklad
David F Dickinson Heart 2005;91:1626–1630.
Electrocardiogram (ECG) registration is an important element in the treatment of patients with various childhood illnesses, including those without clinical signs of heart disease. The basic principles of ECG interpretation in children and adults do not vary. Therefore, the progressive changes in anatomy and physiology that occur during the period from the time of birth to the subadult age, represent the specific features of the ECG that lie during the child’s age. Therefore, the correct interpretation of the ECG relies on the knowledge of changes that have been around for a long time, in order to identify errors that are detected in medicines and in the computer interpretation of the ECG.
Normal ranges of clinically variable 12-channel ECG changes at rest
P wave
The amplitude of the P wave in the child does not change at all. If anyone has an increased reading above 0.025 mV in II, the given trace can be seen as a shift between the norms. Voltage criteria for anterior hypertrophy need to stagnate only when sinus rhythm is preserved, if the entire P wave at the frontal plane lies at the intervals of 0–90°.
Q wave
The majority of the Q wave (II, III, aVF, V5, V6) tends to increase in amplitude over the first few months of life, with a maximum of approximately 3–5 years of age. and further changes to the output value. In the study by Rijnbeek (2001), the upper limit of the amplitude of the normal Q wave is substantially larger, compared to the lower limit in the earlier study by Davignon (1979) (Table 1). Also, the amplitude of the Q wave up to 0.6–0.8 mV lies in the normal range in children aged 6 months to 3 years.
The values in the Rijnbeek table are only for human patients, while those in the Davignon table are for both articles.
Table 1. Q wave amplitude in leads III and V6 according to the tables of Rijnbeek (2001) and Davignon (1979)
| Median for Rijnbeek (98% centile) | Median for Davignon (98% centile) | |||
| III | V6 | III | V6 | |
| 0–1 month | 0,15 (0,26) | 0,11 (0,22) | – | – |
| 1–3 months | 0,29 (0,50) | 0,16 (0,31) | 0,12 (0,55) | 0,03 (0,26) |
| 3–6 months | 0,31 (0,71) | 0,17 (0,35) | 0,13 (0,65) | 0,04 (0,26) |
| 6–12 months | 0,35 (0,79) | 0,20( 0,60) | 0,17 (0,6) | 0,04 (0,3) |
| 1–3 rocks | 0,30 (0,74) | 0,20 (0,56) | 0,13 (0,52) | 0,05 (0,3) |
| 3–5 rocks | 0,19 (0,46) | 0,15 (0,42) | 0,09 (0,40) | 0,07 (0,33) |
| 5–8 rocks | 0,15 (0,36) | 0,12 (0,39) | 0,09 (0,31) | 0,07 (0,45) |
| 8–12 rocks | 0,10 (0,28) | 0,12 (0,43) | 0,05 (0,28) | 0,06 (0,28) |
| 12–16 rocks | 0,10 (0,29) | 0,11 (0,43) | 0,04 (0,3) | 0,04 (0,28) |
QRS complex
The obvious hypertrophy of the right sac in newborns undergoes regression over the first few months of life. This is to change the QRS complex on the ECG. The entire QRS complex at the frontal plane in newborns at the middle becomes 60 to 160°. Over the course of the first years of life, you will need to change the axis, and from this point on, it will inevitably become around 65–70°, although you can vary from 0 to 110°. The amplitude of the R waves in the right thoracic abductors in healthy children changes with age, and in the left thoracic abductors it increases. Change the amplitude of the S wave to a similar or similar extent. The fluidity that comes with changes varies in different ways. In the average case, the R/S of the withdrawn V1 is lost >1 until the age of 3 years, and in healthy individuals - up to the age of 8–12 years. The absolute values of the amplitude of the R and S waves are larger in the studies of Macfarlane (1989) and Rijnbeek (2001) compared with Davignon (1979) (Table 2). For example, the upper boundary of the R wave in advanced V6 in the age group 12–16 years of age became 3.05 mV (Rijnbeek) compared to 2.3 mV (Davignon). However, in some regions, especially V4, the amplitude of the R wave was greater in the previous study.
Table 2. Amplitude of the R wave (mV) at leads V1 and V6, taken from the table of Rijnbeek and Davignon
| Median for Rijnbeek (98% centile) | Median for Davignon (98% centile) | |||
| V1 | V6 | V1 | V6 | |
| 0–1 month | 1,1 (2,05) | 1,0 (1,78) | – | – |
| 1–3 months | 1,23 (2,07) | 1,55 (2,23) | 0,9 (1,8) | 1,2 (2,15) |
| 3–6 months | 1,32 (2,20) | 1,65 (2,73) | 1,0 (2,0) | 1,3 (2,25) |
| 6–12 months | 1,12 (2,14) | 1,7 (2,79) | 0,9 (2,0) | 1,25 (2,25) |
| 1–3 rocks | 1,08 (2,11) | 1,79 (2,96) | 0,85 (1,75) | 1,3 (2,25) |
| 3–5 rocks | 0,95 (1,78) | 1,98 (3,14) | 0,8 (1,75) | 1,5 (2,5) |
| 5–8 rocks | 0,63 (1,48) | 1,97 (2,98) | 0,7 (1,4) | 1,65 (2,8) |
| 8–12 rocks | 0,54 (1,14) | 2,18 (3,24) | 0,5 (1,25) | 1,6 (2,5) |
| 12–16 rocks | 0,48 (1,18) | 2,02 (3,05) | 0,4 (1,0) | 1,5 (2,3) |
Compared with the gold standard - ECG ultrasound in children is a clearly uninformative method for diagnosing left sac hypertrophy, with low specificity and sensitivity. In a recently completed ECG study, criteria for left sac hypertrophy were evident in 15% of children with normal left sac mass on ultrasound follow-up (specificity 85%), while only 12 In 62 children with pathologically increased mass of the left sac, ECG criteria for hypertrophy were detected ( sensitivity 19.4%). Whose investigation has vikoristani normal standards for Davignon. There were no similar differences with normal values for Macfarlane or Rinjbeek. All this allows us to assume that the traditional amplitude criteria for myocardial hypertrophy in children will probably be revised and, if necessary, changed.
The values in the Rijnbeek table are only for human patients, while those in the Davignon table are for both articles.
T wave
In children, the configuration of the T wave is even more pronounced than in adults, especially in the chest. Beware of progressive changes in the axis of the tooth from the time of birth to early adulthood. The fluidity required for these changes may vary in some ways, otherwise it is possible to create customized songs.
In the first 2–3 days of life, positive T waves in the right thoracic abductors (V1 and V3R) are considered normal. During the first part of life, the T waves in these types of teeth are less likely to invert. Looking at the fact that progressive changes in the T wave in the neonatal period occurred in a small number of patients, it is impossible to indicate the exact age in which positive T wave can be seen as a pathology; However, in the Davignon study, the amplitude of the T wave at the 98% centile was positive in the period 0–7 days and negative in the period 7–30 days. Therefore, if a positive T wave persists in leads V1 or V3R after the first life of life, it is necessary to suspect the presence of pathology. The T wave becomes inverted in most children before they reach 12–16 years of age.
In the intermediate adductions V2 and V3, the T wave often inverts in early childhood and progresses to a positive T wave in the successive adductions V3, V2, V1. It was found that in 50% of healthy children in the 3-5 age group there are inverted T waves in the V2 lead, while in the 8-12 age group there are inverted T waves in the V2 lead higher in 5–10% quilting.
The T wave in V5 and V6 is responsible for being positive in all age groups; In a very small number of newborns, the T wave in these cases may be flattened or inverted for 1–3 days.
Rehabilitation in sinus rhythm
Carrying out ambulatory ECG monitoring in healthy children and children of all age groups showed that the correct sinus rhythm can sometimes be interrupted by various variations in the rhythm, which in the early stages can become pathological. To increase the frequency of these changes, it is important to maintain a reasonable range of normal heart rate in children and to establish a relationship between symptoms and changes in heart rate when special conditions are observed. The songs change the heart rhythm and become wider. The stench comes out of a lot of blankets, although not very often. Most types of rhythm disturbances with high composure are likely to be completely benign. However, this assumption was not confirmed by any prospective trial study.
Change the PP interval
Phase changes in the PP interval may also apply to children. If the stench is even obvious, it creates anxiety due to the presence of an irregular heart rhythm. In most episodes, the diagnosis of sinus arrhythmia is easily confirmed by establishing a connection with the phases of breathing (sooner with the hour of sight, quicker with inhalation).
Increase the width (in 50% of newborns) around the PP interval during rapt periods. In older children, the frequency of such episodes changes (in children - up to 16%). Although such sinus pauses are avoided in many cases, they occur infrequently (2–3 in 24 years) and sometimes only in isolated cardiac cycles. In both newborns and older children, the length of the longest recorded pauses did not exceed 1.8–1.9 seconds. In case of sinus arrhythmia in rich children, it is not easy to measure the disturbance of the sinus cycle at rest; in most cases, the exact mechanism of these pauses becomes unimportant. The stench may correspond to the characteristics of sinoatrial block or sinus node nodes, but without direct recording of sinus node potentials, an accurate diagnosis cannot be made. Regardless of the precise mechanism, it is clear that the indicated pauses are wider for any person. Although sickness of the sinus node disappears in small children and can lead to syncope, in the vast majority of children the sinus pause is good.
Change the morphology of the P wave and the PR interval
Changes in the morphology of the P wave, associated with changes in heart rate and changes in the PR interval, occur in 20–30% of speechless children. Such episodes of the junctional rhythm primarily occur after the step-by-step synchronization of the frequency of the sinus rhythm during the hour of sleep, and may also occur during the active period. Most episodes are short, lasting no more than a few seconds or up to about one hour. Whenever you record disturbing episodes, they last for many years. Frequently falling asleep before an hour of sleep over the course of many years, often untouched episodes are recorded.
The PR interval on a 12-channel ECG at rest varies in children, which is important to the heart rate. Therefore, the discomfort is less in young children. In humans, with a heart rate of 100–150 per month, the PR interval is in the range of 80–110 ms, in other cases – up to 150 ms. In children whose heart rate is very low, the upper limit of the norm is approximately 180 ms. Ambulatory ECG monitoring shows that in all age groups, in individuals with a normal PR interval, quiet periods are avoided when the PR interval increases to more than 200 ms. Zokrem, such features were revealed in 8–12% of children aged 10–16 years. Episodes of first-stage AV block were greater during the hour of sleep, and their duration varied from several seconds to many years. In some individuals, first-stage AV block is a great relief from calm.
| Increased changes in heart rate that can be normal: • Virase sinus arrhythmia • Short sinus pauses lasting less than 1.8 seconds • First stage AV block • AV blockade of another stage type Mobitz 1 • Woozles rhythm • Slunic or supraventricular extrasystoles |
Approximately 10% of healthy children show episodes of AV block of another stage, Mobitz type 1 (Wenckebach period). Some, but not all, individuals have obvious episodes of first-stage AV block. The number of episodes can increase from individual isolates to hundreds in 24 years. In some patients, AV block is maintained for a few seconds after the first Wenckebach sequence with a 2:1 ratio. It is very rare to detect progression of Mobitz type 1 AV block to complete AV block. This progression is even more unexpected, so it is recommended to achieve frequent blockade of Mobitz 1 in healthy asymptomatic children.
In subjects who undergo intense physical training, changes in the PR interval appear to occur more frequently during episodes of first-stage and other-stage type 1 AV blockade. 20% padded.
Extrasystoles
Isolated sulcular shortness can be recorded on the initial ECG at rest in 0.2–2.2% of healthy children. When monitored on an outpatient basis, the smell widens and disappears in 20–30% of young children and in about 40% of young boys. Extrasystoles are primarily isolated, but their new morphologies are associated with periods of higher heart rate. In some cases, there are abundant focal extrasystoles, and in some cases, paired ectopic activity. The frequency of extrasystoles does not exceed 1–5 per year. In some individuals, there is a significantly greater frequency of ectopic activity or travails during periods of scapular hemorrhage. Extrasystoles of this type, which are known at the hour of desire, may be good in the future. This is confirmed even by the combined data of extreme caution. In the meantime, some caution is required. It has recently been found that in children with benign sectopic ectopy, the dispersion of the adjusted QT interval is greater than that of the control group. Pathologically increased dispersion of the QT interval is characteristic of patients with long QT interval syndrome. These values in children with benign sectopic ectopy will require further investigation.
In older children who participate in athletic training, ectopic activity occurs in approximately 50% of cases, similar to the frequency in healthy adults. In these cases, ectopic activity is not associated with changes in heart rate. Ectopic complexes are less likely to occur during the hour of sleep and emerge at a higher heart rate than in healthy individuals of the same age in the control group.
Isolated supraventricular ventricular short circuits tend to be wider in all age groups. In newborns, they were detected in 14% of seizures, and in older children - in 15–40%. Typically isolated ectopic complexes occur with a frequency of less than one per year, and in certain cases (often in newborns) - more often, up to 10 per year. If paired ectopic tachycardia, or persistent supraventricular tachycardia, is recorded, it is true that it has not been detected in healthy children.
Trival to the QRS complex
Normal values of the QRS complex, as determined by Davignon, were found in V5. In later studies, the maximum intensity of the QRS complex was identified in all findings, and this can explain the essential significance of the data from earlier and later studies. Beware of daily changes in the QRS complex. According to the Rijnbeek tables, the normal range is from 70–85 ms in newborns to 90–110 ms in adults. In the first three years of life, there are apparently insignificant changes, and later, the disturbance to the QRS complex increases linearly until reaching the middle age.
QT interval
The detection of a prolonged QT interval is important for the evaluation of individuals with an advanced risk of life-threatening arrhythmia. Looking at the length of the QT interval in relation to the frequency of the heart rate, as well as the frequency of the heart rate, the assessment of the QT interval in the pediatric age group is associated with early heart beats. Zagal has accepted the principle of correction depending on the frequency of the heart rhythm, but there is a debate about the method of this correction. We also discuss that it is necessary to take into account other factors, as we will become. In terms of practicality, the most common way to estimate the corrected QT interval (QTc) is to use the Bazett formula: the ratio of the actual QT interval to the square root of the trival interval. They were included in the investigations of Davignon and Rijnbeek. In both studies, the average QTc in children was approximately 410 ms, and the upper range of the norm reached 450 ms.
| Expanded indications for ECG registration in children • Diagnosis and treatment of congenital heart diseases • Diagnosis and treatment of arrhythmias • Diagnosis and treatment of rheumatic fever, Kawasaki disease, pericarditis, myocarditis • Syncope, judging and ''funny turns'' • Episodes of cyanosis • Chest pain or other symptoms during exercise • Family history of rape death or unsafe life • Electrical failures • Stagnation of drugs |
UPLIVER STATI
Uploading articles to the ECG parameters, notes earlier, systematically researched by Rijnbeek and colleagues. In all age groups, changes in the amplitude of the Q, R and S teeth were obvious in boys and girls. The intensity is greatest in the subsurgical region, if the amplitude of the Q, R and S waves is greater in the human condition in most of the thoracic outlets. In the 12–16th century group, these findings were considered reliable (Table 3). We would like to note that there are many risks to the fact that this information is not often used in everyday practice. Obviously, the understanding of the article's considerations will improve the sensitivity and specificity of the diagnostic criteria for scuticular hypertrophy in children.
In the age group 12–16 years of age, 95% of the centile intervals for boys and girls do not overlap.
Table 3. R wave amplitude (mV) in boys and girls at V1 and V6 levels according to Rijnbeek tables
| Median for boys (98% centile) | Median for girls (98% centile) | |||
| V1 | V6 | V1 | V6 | |
| 0–1 month | 1,1 (2,05) | 1,0 (1,78) | 1,35 (2,2) | 0,93 (1,64) |
| 1–3 months | 1,23 (2,07) | 1,55 (2,23) | 1,17 (1,99) | 1,51 (2,67) |
| 3–6 months | 1,32 (2,20) | 1,65 (2,73) | 1,14 (2,04) | 1,6 (2,8) |
| 6–12 months | 1,12 (2,14) | 1,7 (2,79) | 1,01 (1,92) | 1,68 (2,74) |
| 1–3 rocks | 1,08 (2,11) | 1,79 (2,96) | 1,01 (1,91) | 1,68 (2,67) |
| 3–5 rocks | 0,95 (1,78) | 1,98 (3,14) | 0,77 (1,38) | 1,89 (2,91) |
| 5–8 rocks | 0,63 (1,48) | 1,97 (2,98) | 0,55 (1,24) | 2,05 (3,25) |
| 8–12 rocks | 0,54 (1,14) | 2,18 (3,24) | 0,49 (1,14) | 2,0 (3,04) |
| 12–16 rocks | 0,48 (1,18) | 2,02 (3,05) | 0,35 (1,10) | 1,65 (2,52) |
In childhood, there is no current surge at ECG intervals, although some minor activities can be increased. The Rijnbeek tables show that the disturbance of the QRS complex is greater among boys of all age groups, less so among girls. However, the absolute magnitude is insignificant—approximately 2–5 ms for median QRS velocity—and obviously not significant for everyday practice. In pre-pubescent children, the increase in weight does not significantly affect the QT interval. The sublime age group has a small, but melodious, reliable quality. In the research of Rijnbeek, the upper limits of QTc standards were slightly closer for boys and girls. It has been established that QTc levels are significantly higher in girls over 14 years of age, which is obviously due to changes in boys and not increases in girls. In girls of the age group, a QTc of 460 ms is considered to be at the upper end of the norm.
VISNOVKI
The standards of normal values necessary for the interpretation of the ECG in children have been known for many years. Recently, recent research suggests that these standards will require revision through changes in the setting for ECG registration, and also, possibly, due to physiological changes in children. Changes in heart rate, which are expected in healthy children during the 24-year ECG registration, are welcome, but these changes (as they stink) were not systematically monitored.
Prepared by Oleg Zharinov
Special types of electrocardiography
In some cases, as prescribed by a pediatrician or pediatric cardiologist, special electrocardiographic studies may be prescribed for older children.
Bicycle erogmetry (stress test): when a cardiogram is taken during dosed physical activity (rotating the pedals of an exercise bike). This study allows you to see how a child’s heart reacts to physical activity.
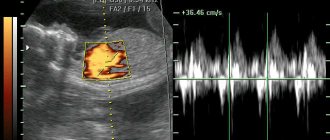
Holter monitoring : For an in-depth study of arrhythmias, a long-term ECG recording of 15-20 minutes may be required. To identify hidden disturbances in the blood supply to the heart and the rhythm of its work over a long period of time, ECG Holter monitoring is used. In this case, electrodes are attached to the child's skin, and a small computer-cardiograph is hung on the child's neck or belt, which constantly records the ECG.
Decoding the results
ECG results are available almost immediately. When performing electrocardiography on a traditional device with recording the results on paper or when analyzing the ECG of a baby under the age of 1 year, the doctor will need some time to decipher the results. When using a computer electrocardiograph, a conclusion with calculations of all the main parameters of the cardiogram is issued almost instantly. ECG recordings in this case are stored in the form of computer files that can be viewed and printed. In the case of analyzing the cardiogram of children under 1 year of age, if deviations from the norm are found in the cardiogram, the help of a cardiologist may be required to decipher and interpret the cardiogram.
In some cases, a repeat electrocardiographic study or a special type of ECG may be required, accompanied by other types of studies (ultrasound of the heart, Doppler sonography of blood vessels).
Electrocardiographic monitoring of the heart condition in a child
As your baby develops from fetus to newborn, infant to child, teenager to adult, the body's growth and development causes major permanent changes in the size and position of your baby's heart. The most dramatic of these changes occur at birth and during the first year of life. Unfortunately, not all children undergo such significant changes in the body without complications. Therefore, doctors recommend regular preventive electrocardiographic monitoring of your child’s heart function. Early detection of pathology or a predisposition to it will allow you to choose and carry out the required treatment with maximum effectiveness, or make sure that your child is healthy and his body is developing without deviations from the norm.
Remember that if any abnormalities are detected on the ECG, further examination of the child’s cardiovascular system is recommended. Also, all children with detected changes on the ECG are subject to dynamic monitoring by a pediatric cardiologist.
Electrocardiography is an informative, fast and safe method of studying the condition of a child’s heart, which allows you to accurately establish a diagnosis and carry out the required treatment with maximum efficiency, or get rid of worries and doubts about the state of your baby’s health.
To obtain additional information about electrocardiography for a child, you can sign up for diagnostics at a medical center by calling +7 (812) 331-24-22.
ECG of a child. Peculiarities
25.09.2011 34286
Features of a children's cardiogram.
Atrial complex (P wave). In children, as in adults, the P wave is small (0.5-2.5 mm), with maximum amplitude in standard leads I and II. In most leads it is positive (I, II, aVF, V2-V6), in lead aVR it is always negative, in leads III, aVL, V1 it can be smoothed, biphasic or negative. In children, a slightly negative P wave in lead V2 is also allowed.
The greatest features of the P wave are observed in newborns, which is explained by increased electrical activity of the atria due to the conditions of intrauterine circulation and its postnatal restructuring. In newborns, the P wave in standard leads, compared to the size of the R wave, is relatively high (but in amplitude no more than 2.5 mm), pointed, and sometimes may have a small notch at the apex as a result of non-simultaneous coverage of the right and left atria by excitation (but not more than 0 .02-0.03 s). As the child grows, the amplitude of the P wave decreases slightly. With age, the ratio of the size of the P and R waves in standard leads also changes. In newborns it is 1:3, 1:4. as the amplitude of the R wave increases and the amplitude of the P wave decreases, this ratio by 1-2 years decreases to 1:6, and after 2 years it becomes the same as in adults - 1:8; 1:10.
The smaller the child, the shorter the duration of the P wave. It increases on average from 0.05 s in newborns to 0.09 s in older children and adults.
Features of the PQ interval in children . The duration of the PQ interval depends on heart rate (the higher the heart rate, the shorter the PQ interval) and age. As children grow, there is a noticeable increase in the duration of the PQ interval: on average from 0.10 s (not more than 0.13 s) in newborns to 0.14 s (not more than 0.18 s) in adolescents and 0.16 s (not more than 0.20 s) in adults.
Features of the QRS complex in children . In children, the time of ventricular excitation coverage (QRS interval) increases with age: on average from 0.045 s in newborns to 0.07-0.08 s in older children and adults (Appendix Table 3).
Wave Q. In children, as in adults, it is recorded inconsistently, more often in II, III, aVF, left chest leads (V4-V6), less often in I and aVL leads. In lead aVR, a deep and wide Q wave of the Qr type or QS complex is detected. In the right chest leads, Q waves, as a rule, are not recorded. In young children, the Q wave in standard leads I and II is often absent or weakly expressed, and in children of the first 3 months - also in V5, V6. Thus, the frequency of registration of the Q wave in various leads increases with the age of the child.
The amplitude of the Q waves in most leads is small (1-3 mm) and their size changes little with the age of the child, except for two leads - standard III and aVR.
In standard lead III in all age groups, the Q wave is also small on average (2 mm), but can be deep and reach up to 5 mm in newborns and infants; in early and preschool age - up to 7-9 mm and only in schoolchildren it begins to decrease, reaching a maximum of 5 mm. Sometimes, in healthy adults, a deep Q wave is recorded in standard lead III (up to 4-7 mm). In all age groups of children, the size of the Q wave in this lead can exceed the size of the R wave.
In lead aVR, the Q wave has a maximum depth, which increases with the age of the child: from 1.5-2 mm in newborns to 5 mm on average (with a maximum of 7-8 mm) in infants and at an early age, up to 7 mm on average (with a maximum of 11 mm) in preschool children and up to 8 mm on average (with a maximum of 14 mm) in schoolchildren. The duration of the Q wave should not exceed 0.02-0.03 s.
R wave. In children, as in adults, R waves are usually recorded in all leads, only in aVR they can be small or absent (sometimes in lead V1). There are significant fluctuations in the amplitude of the R waves in various leads from 1-2 mm to 15 mm, but the maximum value of the R waves in standard leads is up to 20 mm, and in the chest leads - up to 25 mm. The amplitude of the R waves in different leads depends on the position of the electrical axis of the heart (it is important to evaluate the ratio of the sizes of the R and S waves in different leads), and therefore changes in children of different age groups. The smallest magnitude of R waves is observed in newborns, especially in the strengthened unipolar and chest leads. However, even in newborns, the amplitude of the R wave in standard lead III is quite large, since the electrical axis of the heart is deviated to the right. After the 1st month, the amplitude of the RIII wave decreases, the magnitude of the R waves in the remaining leads gradually increases, especially noticeably in the II and I standard and in the left (V4-V6) chest leads, reaching a maximum at school age.
With a normal position of the electrical axis of the heart, high R waves with a maximum of RII are recorded in all limb leads (except aVR). In the chest leads, the amplitude of the R waves increases from left to right from V1 (r wave) to V4 with a maximum of RV4, then decreases slightly, but the R waves in the left chest leads are higher than in the right ones. Normally, in lead V1, the R wave may be absent and then a QS-type complex is recorded. In children, the QS type complex is also rarely allowed in leads V2, V3.
In newborns, electrical alternans is allowed - fluctuations in the height of the R waves in the same lead. Variants of the age norm also include respiratory alternation of ECG waves.
In children, thickening, notching, and splitting are often found on the R (sometimes S) waves. Their presence is unimportant if they are detected only in one lead, in the transition zone or on low-voltage waves. The degree of their significance increases if they are located close to the top of the waves, which have a sufficiently large amplitude, and are detected in several leads. In such cases, they speak of a violation of the propagation of excitation throughout the myocardium of a particular ventricle.
In children, deformation of the QRS complex in the form of the letters “M” or “W” in the III standard and V1 leads is often found in all age groups, starting from the neonatal period. In this case, the duration of the QRS complex does not exceed the age norm. Splitting of the QRS complex in healthy children in V1 is referred to as “slow excitation syndrome of the right supraventricular crest” or “incomplete block of the right bundle branch.” The origin of this phenomenon is associated with the excitation of the hypertrophied right “supraventricular scallop” located in the region of the pulmonary cone of the right ventricle, which is the last to be excited. The position of the heart in the chest and the electrical activity of the right and left ventricles changing with age are also important.
The internal deviation interval (time of activation of the right and left ventricles) in children changes as follows. The activation time of the left ventricle (V6) increases from 0.025 s in newborns to 0.045 s in schoolchildren, reflecting an accelerated increase in the mass of the left ventricle. The activation time of the right ventricle (V1) practically does not change with the age of the child, amounting to 0.02-0.03 s.
In young children, there is a change in the localization of the transition zone (thoracic lead, in which the R and S waves of equal amplitude are recorded) due to a change in the position of the heart in the chest (rotations around the axes) and a change in the electrical activity of the right and left ventricles. In newborns, the transition zone is located in lead V5, which characterizes the dominance of the electrical activity of the right ventricle. At the age of 1 month, the transition zone shifts to leads V3, V4, and after 1 year it is localized in the same place as in older children and adults - in V3 with vibrations V2-V4. Together with an increase in the amplitude of the R waves and deepening of the S waves in the corresponding leads, and an increase in the activation time of the left ventricle, this reflects an increase in the electrical activity of the left ventricle.
S wave . In children, as in adults, the amplitude of the S waves in different leads varies widely: from none in a few leads to a maximum of 15-16 mm, depending on the position of the electrical axis of the heart. The amplitude of the S waves changes with the age of the child. Newborn children have the smallest depth of S waves in all leads (from 0 mm to 3 mm), except standard I, where the S wave is quite deep (on average 7 mm, maximum up to 13 mm). This reflects the deviation of the electrical axis of the heart to the right.
In children older than 1 month, the depth of the S wave in the first standard lead decreases and subsequently in all limb leads (except aVR) S waves of small amplitude (from 0 mm to 4 mm) are recorded, the same as in adults. In healthy children, in leads I, II, III, aVL and aVF, the R waves are usually larger than the S waves.
As the child grows, there is a deepening of the S waves in precordial leads V1-V4 and in lead aVR, reaching their maximum value at high school age. In the left chest leads V5-V6, on the contrary, the amplitude of the S waves decreases, often they are not recorded at all. In the chest leads, the depth of the S waves decreases from left to right from V1 to V4, having the greatest depth in leads V1 and V2.
Sometimes in healthy children with an asthenic physique, with a so-called “hanging heart,” an S-type ECG is recorded. In this case, the S waves in all standard (SI, SII, SIII) and chest leads are equal to or exceed the R waves with reduced amplitude. It is believed that this is due to the rotation of the heart around the transverse axis with the apex posteriorly and around the longitudinal axis with the right ventricle forward. In this case, it is almost impossible to determine the angle ?, so it is not determined. If the S waves are shallow and there is no shift of the transition zone to the left, then we can assume that this is a normal variant. More often, the S-type ECG is determined by pathology.
Variants of the age norm include “comb syndrome”, already mentioned above, i.e. delayed excitation of the right supraventricular crest - widening and jaggedness on the ascending limb of the S wave in lead V1, sometimes V2.
Features of the ST segment in children . Just like in adults, in children the ST segment should be isoelectric, but in a normal ECG the ST segment does not completely coincide with the isoelectric line. The strictly horizontal direction of the ST segment in all leads except III can be considered a pathology. Shifts of the ST segment up and down are allowed up to 1 mm in the limb leads and up to 1.5-2 mm in the chest leads, especially in the right ones. These shifts do not mean pathology if there are no other changes on the ECG. In newborns, the ST segment is often not expressed and the S wave, when reaching the isoline, immediately turns into a gently rising T wave.
Features of the T wave in children . In older children, as in adults, the T waves are positive in most leads (standard I, II, aVF, V4-V6). In standard III and aVL leads, T waves can be smoothed, biphasic or negative; in the right chest leads (V1-V3) are often negative or smoothed; in lead aVR – always negative.
The greatest differences in T waves are observed in newborns. In their standard leads, the T waves are low-amplitude (from 0.5 mm to 1.5-2 mm) or smoothed. In a number of leads, where T waves in children of other age groups and adults are normally positive, in newborns they are negative and vice versa. Thus, in newborns there may be negative T waves in standard I, II, in strengthened unipolar and in the left chest leads; may be positive in standard III and right chest leads. By 2-4 weeks of life, inversion of the T waves occurs, i.e. in the I, II standard, aVF and left chest leads (except V4) they become positive, in the right chest and V4 - negative, in the III standard and aVL - they can be smoothed, biphasic or negative.
In subsequent years, negative T waves persist in lead V4 until 5-11 years, in lead V3 - up to 10-15 years, in lead V2 - up to 12-16 years, although in leads V1 and V2 negative T waves are allowed in some cases and in healthy adults.
After the 1st month of life, the amplitude of the T waves gradually increases, ranging from 1 to 5 mm in standard leads and from 1 to 8 mm in chest leads in young children. In schoolchildren, the size of T waves reaches the level of adults and ranges from 1 to 7 mm in standard leads and from 1 to 12-15 mm in chest leads. The T wave is largest in lead V4, sometimes in V3, and in leads V5, V6 its amplitude decreases.
Features of the QRST complex in children (electric systole). Analysis of electrical systole makes it possible to assess the functional state of the myocardium. Young children, especially in the 1st year of life, are characterized by electrical instability of the myocardium, which is aggravated by any pathological process in the child’s body, which is reflected on the ECG. The following features of electrical systole in children can be identified, reflecting the electrophysiological properties of the myocardium changing with age.
§ Increase in the duration of the QT interval as the child grows from 0.24-0.27 s in newborns to 0.33-0.4 s in older children and adults (Table 4 of the appendix). The indicator reflects the time during which the ventricles are in an electrically active state.
§ With age, the relationship between the duration of the electrical systole and the duration of the cardiac cycle changes, which is reflected by the systolic index (SP). In newborn children, the duration of electrical systole occupies more than half (SP = 55-60%) of the duration of the cardiac cycle, and in older children and adults - 1/3 or slightly more (37-44%), i.e. SP decreases with age.
§ With age, the ratio of the duration of the electrical systole phases changes: the excitation phase (from the beginning of the Q wave to the beginning of the T wave) and the recovery phase, i.e. rapid repolarization (T wave duration). In newborns, more time is spent on recovery processes in the myocardium than on the excitation phase. In young children, these phases take approximately the same time. In 2/3 of preschoolers and most schoolchildren, just like in adults, more time is spent on the arousal phase.
§ Changes in electrical systole in children occur quite often, especially at an early age, reflecting the electrical instability of the myocardium, which is aggravated by any pathological process in the child’s body.
To summarize, we can highlight the following features of children's ECGs:.
1. The heart rate is more frequent, its lability and large individual fluctuations are noted. As the child ages, the heart rate decreases and the heart rate stabilizes.
2. Sinus arrhythmia is often recorded.
3. A decrease in the voltage of the QRS complex waves in the first days of life with a subsequent increase in their amplitude.
4. Deviation of the electrical axis of the heart to the right in newborns with a gradual transition to a vertical position at an early age, and subsequently to a normogram, but a high frequency of vertical position remains even in adolescents and young adults.
5. Shorter duration of intervals, waves, ECG complexes as a result of faster conduction of excitation, with their gradual increase with age.
6. The presence of high, pointed P waves in newborns and young children, followed by a decrease in their amplitude.
7. The frequency of registration of the Q wave in various leads increases with age. The Q wave is most pronounced in aVF and, especially, in standard lead III, where it can be deep, especially in early and preschool age, and exceed ? R wave size.
8. Deformation of the initial ventricular QRS complex in the form of the letters W or M in standard III and V1 leads is often recorded in all age periods - delayed excitation syndrome of the right supraventricular crest.
9. With age, the amplitude of the R and S waves and their ratio in different leads changes, which reflects a change in the position of the heart in the chest and the influence of other factors.
10. Low amplitude of T waves in newborns with its subsequent increase. The presence of negative T waves in the right thoracic (V1-V3) and V4 leads before school age.
11. With age, the activation time of the left ventricle increases (the duration of the interval of internal deviation in V6) and the transition zone shifts from V5 in newborns to V3 (V2-V4) after 1 year of life.
12. With age, the duration of the electrical systole increases, but its duration decreases in relation to the duration of the cardiac cycle (decrease in SP), and the ratio between the phases of the electrical systole also changes towards increasing the duration of the excitation phase.
Some ECG changes (syndromes) in practically healthy children can be attributed to variants of the age norm (transient changes). These include:
- moderately severe sinus tachy- or bradycardia;
- respiratory (electrical) alternation of ECG waves associated with significant excursions of the diaphragm;
- average right atrial rhythm;
- migration of the pacemaker between the sinus node and mid-atrial centers of automaticity in adolescents;
- “crest” syndrome - delayed excitation of the right supraventricular scallop - deformation of the QRS complex in leads III and V1 or jaggedness of the S wave in leads V1 and/or V2.